
In this edition of Value Reports we examined the IPO market in 2017, which registered a comeback in listings when compared to prior years.
Using the Economatica system to filter through our comprehensive US data set we discovered there were 159 IPOs in 2017.
Here are a few general observations about this group before diving into the details of the top and bottom performing new stocks for 2017:
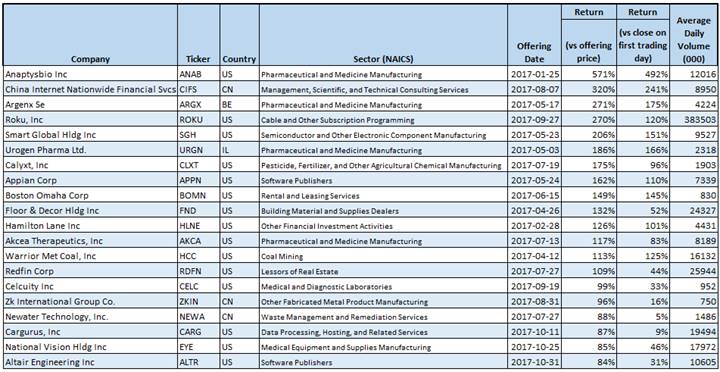
Among the best performing stocks launched in 2017 five posted over a 200% return(versus the offering price). These are Anaptysbio, Inc, China Internet Nationawide Financial Services, Argenx Se, Roku, Inc., and Smart Global Holdings, Inc. The best performing stock on its opening day was Anaptysbio, Inc., which returned 492% on January 26.
Fifteen of the top IPOs from 2017 are from the US while 5 are from abroad. Nine of these stocks are manufacturers.
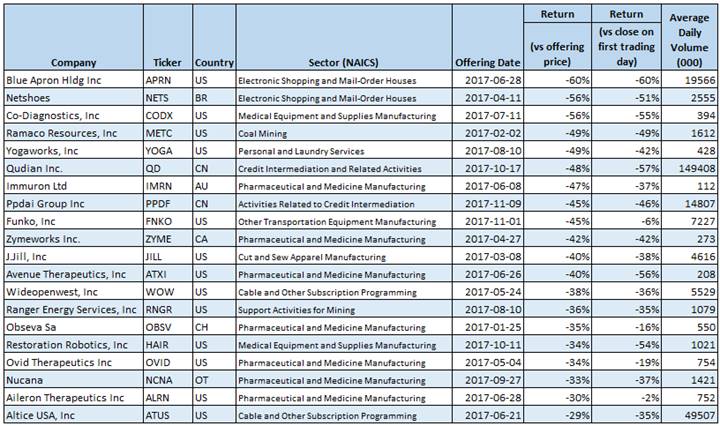
Looking at the worst performing companies the five companies which disappointed investors are Blue Apron Holdings, Inc., Netshoes, Co-Diagnostics, Inc., Ramaco Resources, Inc., and Yogaworks, Inc. Blue Apron also had the most negative opening day, with a return (versus its closing price on first trading day) of – 60%. The stock which had the lowest negative return on its opening day was Alleron Therapeutics, Inc., which dropped just – 2%.
Thirteen companies are from the US and seven are foreign listings, including two Chinese listings. Eleven companies are manufacturers.
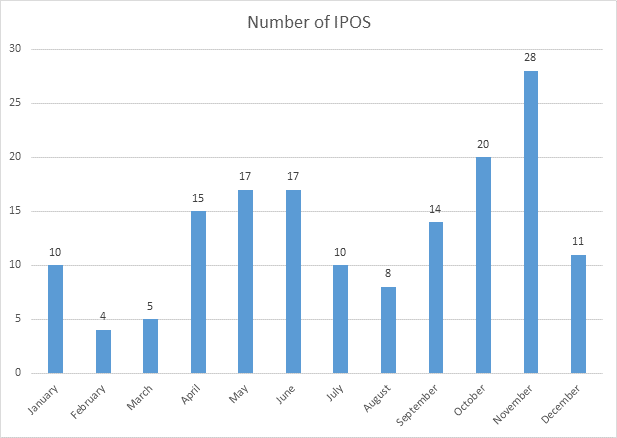
The highest number of IPOs was in the month of November, with 28 new stocks making their debut. The months of April, May, June, October, and November each had 15 or more companies going public while the least busy months were February, March, and August. Please see the table below for details.
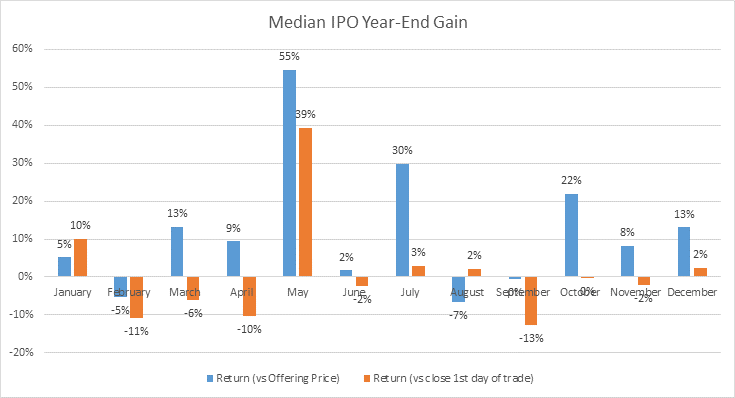
The chart below depicts the median return compared to offering price and closing price on first trading day.
The 17 IPOs listed in May 2017 was the best performing group, with a median return of 55% (versus opening price) and 39% (versus closing price on first trading day).
Ask us for a free trial and you can use the Economatica system to generate your own observations and dig deeper.

In this edition of Value Reports we examined the IPO market in the 1st half...

In this edition of Value Reports, we explore the Top 25 foreign stocks ranked by...

Using the Economatica system we calculated the EV/EBITDA (TTM) multiple for key sectors in the...