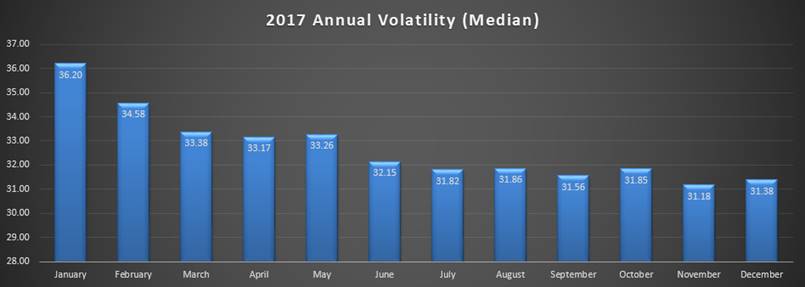

We used the Economatica system to examine the monthly trend in volatility for our final Value Report this year.
The data shows that volatility has exhibited a steady decline year to date for most sectors.
The Educational Services industry, with only 16 companies participating, saw the biggest decline in volatility, dropping 23% since January. The Transportation and Warehousing sector, with 78 participants, was a close second with a 22% decline while the Utilities sector, comprised of 88 participants, dropped 21% when compared to the beginning of the year.
The Manufacturing and Finance and Insurance sectors represent 2,187 companies. These two industries saw volatility decline 10% each since January. This combined group represents approximately 60% of the companies sampled in this report. The Construction sector, with 53 participating companies, also saw its volatility decline 10% in the year.
Only one sector, the Retail Trade industry, with 153 participating companies, experienced a 9% increase in volatility for the period examined, which given its overall negative performance for the year, as highlighted in one of our recent Value Reports, isn’t surprising.

We aggregated these 18 sectors, a group comprised of 3,575 companies, and dug deeper into this trend in volatility and identified the median value for each month of 2017. It is clear, overall, that volatility has indeed steadily declined across the broader market.
January, February, and March saw the highest median values for volatility this year, 36.20, 34.58, and 33.38 respectively. In May, the median volatility ticked slightly higher from 33.17 to 33.26. The other months of the year all had median values below 33. And, starting in July up to the end of the year in December (through 12/20), the median dropped below 32.

You can use the Economatica system to generate your own observations. Ask us for a free trail and see how Economatica can help you make better investment decisions.
In this edition of Value Reports we examined the IPO market in the 1st half...
In this edition of Value Reports, we explore the Top 25 foreign stocks ranked by...
Using the Economatica system we calculated the EV/EBITDA (TTM) multiple for key sectors in the...