
In this edition of Value Reports we examined the relationship between Risk & Return for key sectors of the U.S. market.
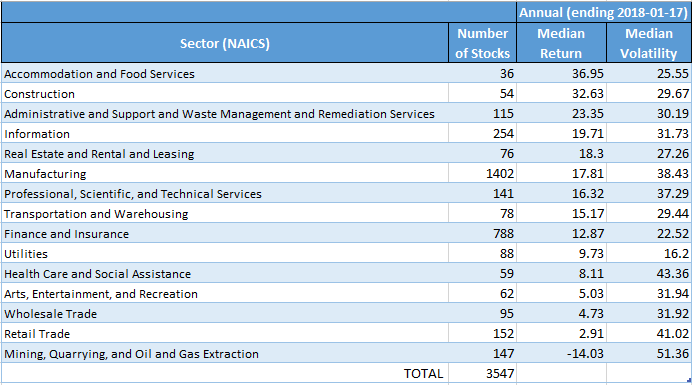
Using the Economatica system we profiled the stocks of over 3,500 companies and aggregated them according to sector, using NAICS Level 1, and then ranked them by median Annual Return. We used Annual Volatility as a measure of risk. This metric was calculated using daily returns over the last 12 months.
Risk and return analysis often plays a key role in most individual decision making processes and Economatica can help you with stock selection by first taking a look at how key sectors are performing. And, with diversification in mind, you can see which sectors might warrant digging deeper into for the purposes of examining specific stocks within each industry.
The scatter plot chart below highlights the relationship between the median Annual Volatility and the Annual Return of each sector.
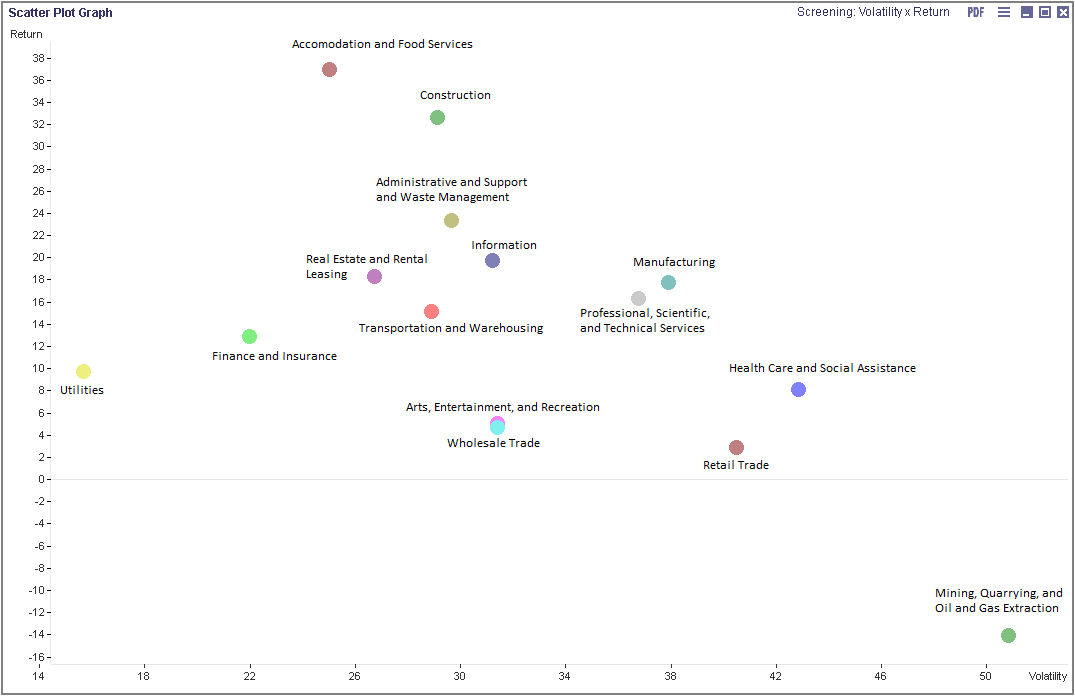
The Accommodation and Food Services and Construction sectors, which are comprised of only 90 stocks, each had median Annual Returns above 30% and median Annual Volatility below 30%.
The Manufacturing and Finance and Insurance sectors had the highest number of participating stocks in this analysis – 1,402 and 788 respectively. Manufacturers had a median return of 17.81% and median volatility of 38.43% while Financial institutions posted a lower return of 12.87% with considerably lower volatility.
The sectors which had low yet positive median returns with comparably higher median volatility values include: Health Care and Social Assistance, Arts, Entertainment, and Recreation, Wholesale Trade, and Retail Trade. Together, these sectors are represented by 368 stocks.
The Utilities sector posted a median return of 9.73% and had median volatility of 16.2, an example of low fluctuation in the value of the 88 stocks in the industry.
The most obvious outlier in terms of both return and volatility is the Mining, Quarrying, and Oil and Gas Extraction sector. The median return for the 147 participating stocks was – 14.03% while its median volatility was 51.36%, the highest value discovered in this analysis.
Become part of our community of financial intelligence. Request a free trial and see how Economatica can help you make better investment decisions.

In this edition of Value Reports we examined the IPO market in the 1st half...

In this edition of Value Reports, we explore the Top 25 foreign stocks ranked by...

Using the Economatica system we calculated the EV/EBITDA (TTM) multiple for key sectors in the...