
We explore year-to-date sector returns of the market and identify the clear winner.
Using the Economatica system to filter through our comprehensive database of US exchange listed stocks, aggregating returns by sector to identify the industry with the highest year-to-date return.
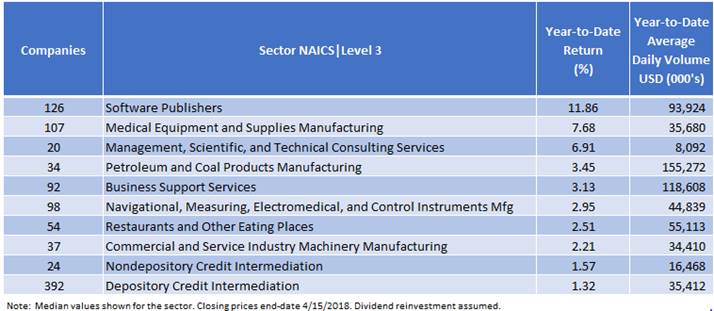
Now, while the broader market indices have been relatively flat through 4/15/2018, with the S&P 500 down just -0.65% and the Dow Jones Industrial Average down -1.45% for the year, the Software Publishers within the Tech sector has dominated the market so far this year, boasting a year-to-date return of 11.86%. The participating companies within the Medical Equipment and Supplies Manufacturing and Management, Scientific, and Technical Consulting Services sectors have second and third highest year-to-date returns (7.68% and 6.91%, respectively).
The table below shows the Top 10 performers by sector based on Year-to-Date Returns through 4/15/2018.
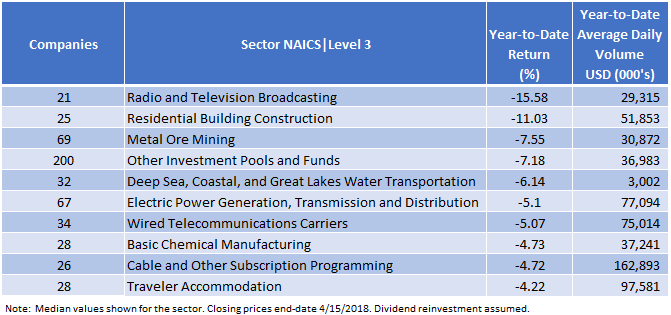
In contrast, the table below shows the Bottom 10 performers by sector so far this year (again through 4/15/2018).
The “biggest” losers so far this year include the Radio and Television Broadcasting, Residential Building Construction, and Metal Ore Mining sectors, with negative year-to-date returns of -15,58%, -11.03%, and -7.55%, respectively.
Since the Software Publishing sector had the highest year-to-date return we wanted to compare its performance with the broader market indices. To do this we created an index consisting of the 126 participating companies in this sector and plotted this index against the S&P 500 and Dow Jones indices.
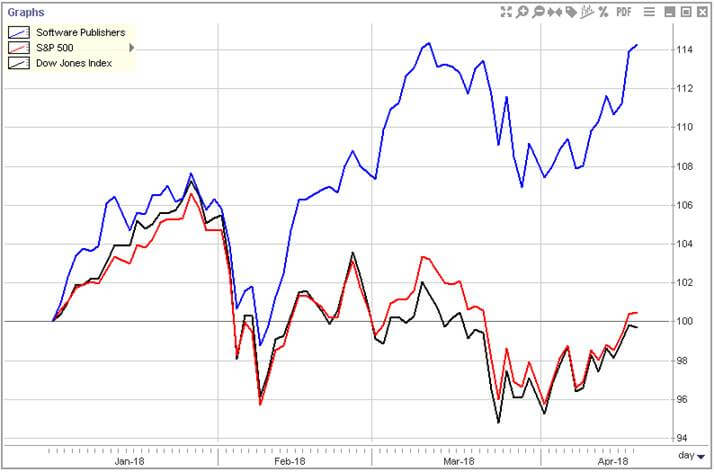
Using the Economatica system to build indices like the one depicted in the chart above clearly demonstrates this sector’s impressive year-to-date performance.
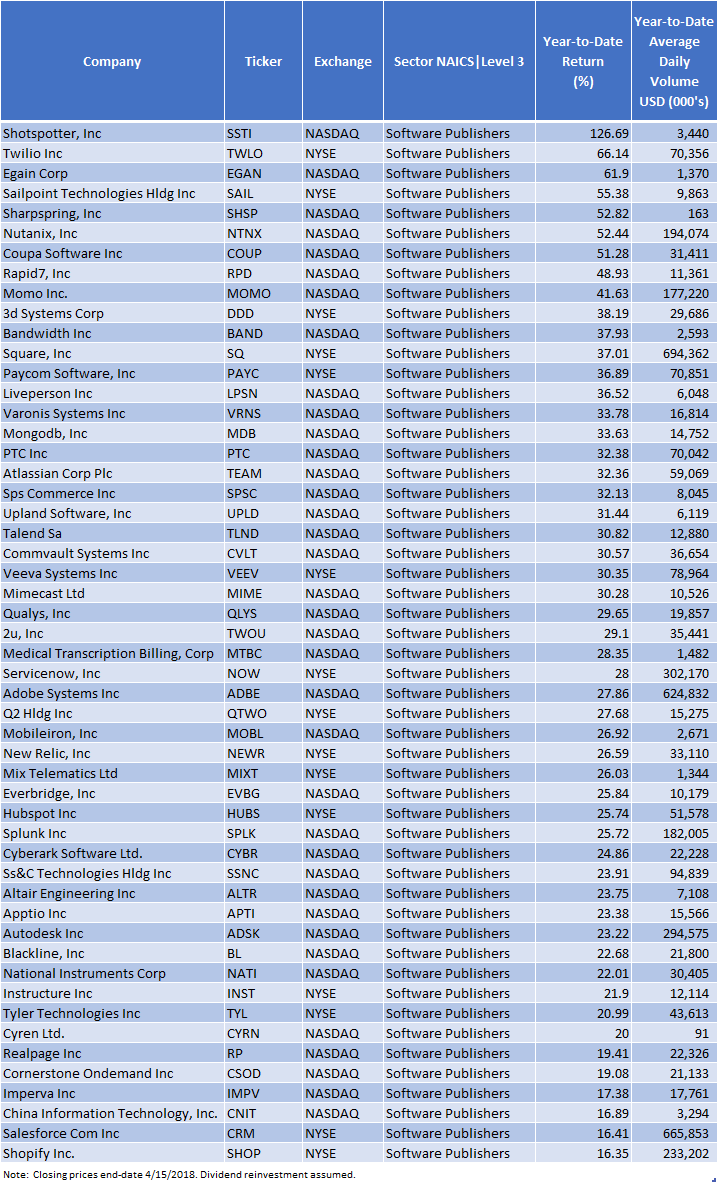
Ranking the 50 Best Performing Software Publishers by Year to Date Return, highest to lowest, we identified a clear winner: Shotspotter, Inc., the global leader in gunfire detection and location technology, has posted an impressive 126.7% YTD return. Taking second and third place in this ranking are Twilo, Inc. and Egain Corp, which posted year-to-date returns of 66.14% and 61.9%, respectively.
While still posting positive year-to-date returns the companies taking 48th, 49th and 50th place are China Information Technology, Inc. (16.89%), Salesforce.com, Inc. (16.41%), and Shopify, Inc. (16.35%).
On a year-to-date average daily volume basis Square, Inc. had the highest value, followed by Salesforce.com and Adobe Systems, Inc. And, the three companies with the lowest value for this trading metric are Cyren Ltd., Sharpspring, Inc., and Mix Telematics Ltd.
The Economatica system has sophisticated analytic tools and comprehensive highly reliable financial data giving investment professionals the flexibility needed to identify trends, uncover potential opportunities, and manage risk. Find out more.

In this edition of Value Reports we examined the IPO market in the 1st half...

In this edition of Value Reports, we explore the Top 25 foreign stocks ranked by...

Using the Economatica system we calculated the EV/EBITDA (TTM) multiple for key sectors in the...