
Using the Economatica system we identified 538 companies that have released their 4th Quarter financial statements and then aggregated their Earnings Per Share (EPS) by sector (NAICS Level 1).
We calculated the median values for each industry and then compared these values to the same quarter a year ago in 2016.
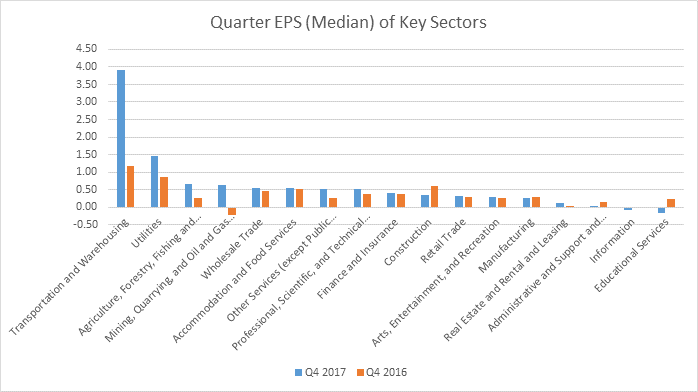
Here are several observations we made about these sector aggregates from the table and bar chart below (which rank sector EPS from highest to lowest):
The three sectors which had the highest median EPS for Q4 2017 are Transportation and Warehousing, Utilities, and Agriculture, Forestry, Fishing and Hunting. The median values for each of these sectors are $3.90, $1.45, and $0.67, respectively.
The sector with the highest percentage increase is Mining, Quarrying, and Oil & Gas Extraction, which shows a YOY increase of 364% in EPS. Transportation and Warehousing shows a 235% change, Real Estate and Leasing increased 182%, Agriculture, Forestry, Fishing and Hunting grew 153%, and Other Services (except Public Administration) increased 113% over Q4 2016. The results are compiled from just 25 companies.
Five sectors, comprised of 352 participating companies, saw their median EPS values drop.
These were, from worst to least worse, Information, which dropped – 2,432% in Q4 2017, Education Services, which declined – 168%, Administrative and Support and Waste Management and Remediation Services, which dropped – 80%, Construction, which contracted – 41%, and Manufacturing, whose median EPS value declined – 4% when compared to Q4 2016.
Retail Trade’s median EPS for Q4 2017, with 95 companies participating in this earnings report, grew only slightly, increasing just 2%.
 Note: Q4 = Financial Statements dated between Oct 8 and Jan 7
EPS reflects earnings over the 3-month period
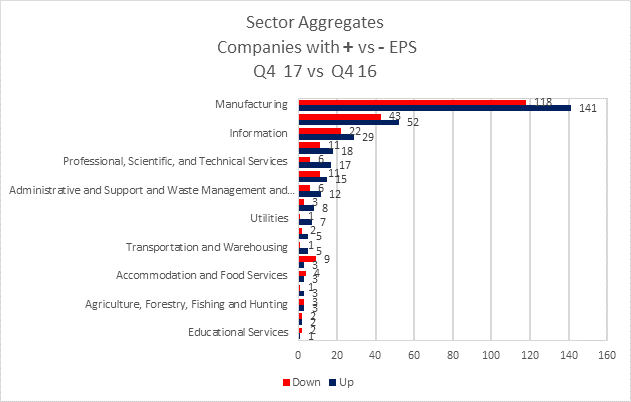
285 companies, approximately 53% of the companies Economatica examined, reported higher EPS for the fourth quarter than a year ago. The Manufacturing, Retail Trade, and Information sectors have a total of 222 companies showing higher EPS in Q4 2017. Please take a look at the bar chart below to see how the numbers break down for each sector:
We also used the Economatica system to highlight the correlation between Revenues Per Share (RPS) and Earnings Per Share for these key sectors.
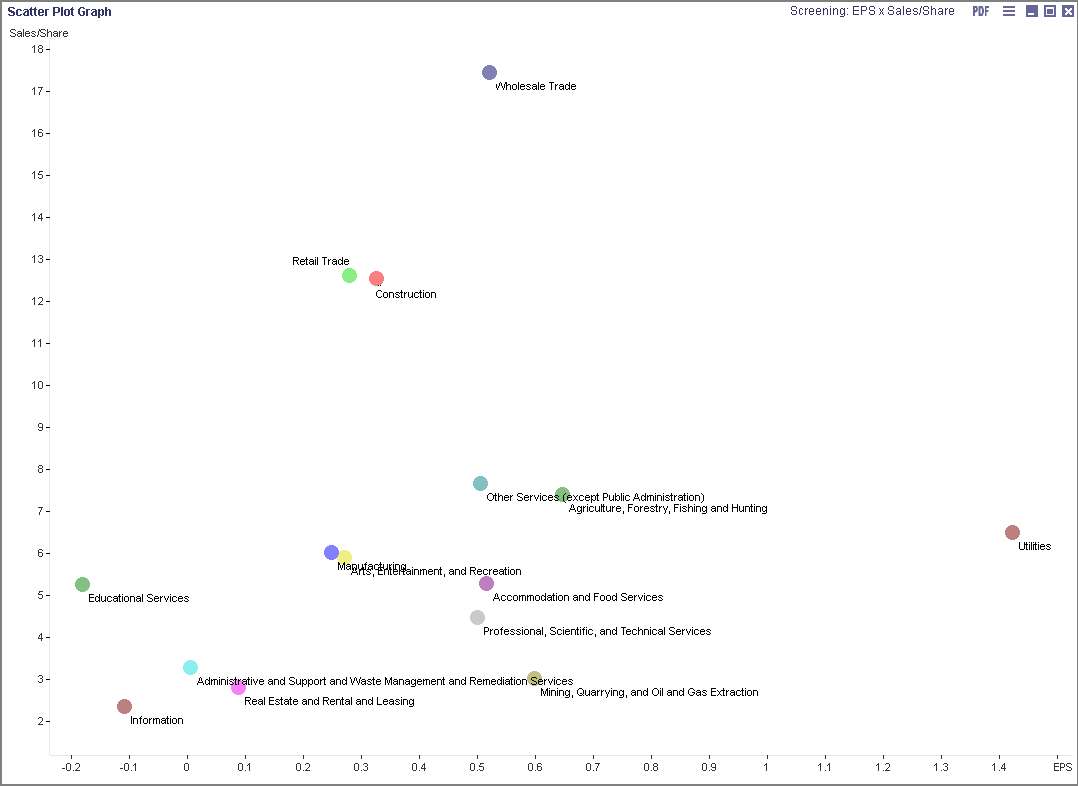
Now, it’s understood that many investors are driven by EPS while still other investors are interested in the top line. So, how do you identify the sectors you may want to examine more closely for opportunities?
Looking at the scatter plot chart above we notice the Utilities sector has far and away the highest median EPS value, which is not surprising, and could be where an investor finds an attractive earnings driven opportunity.
On the other hand, the Wholesale Trade sector has the highest median RPS value, so investors who find top line revenue compelling, may find opportunities within this industry. As for what’s in between these two bookends, so to speak, or using other criteria to identify suitable investments, it’s up to you to dig deeper.
Economatica has the tools to make sense of it all and will help discretionary and quantitative asset managers examine investment opportunities with a flexible, easy to use online research platform. Ask us for a free trial today and see how the Economatica system can improve your in house research activities for a low monthly fee.

In this edition of Value Reports we examined the IPO market in the 1st half...

In this edition of Value Reports, we explore the Top 25 foreign stocks ranked by...

Using the Economatica system we calculated the EV/EBITDA (TTM) multiple for key sectors in the...