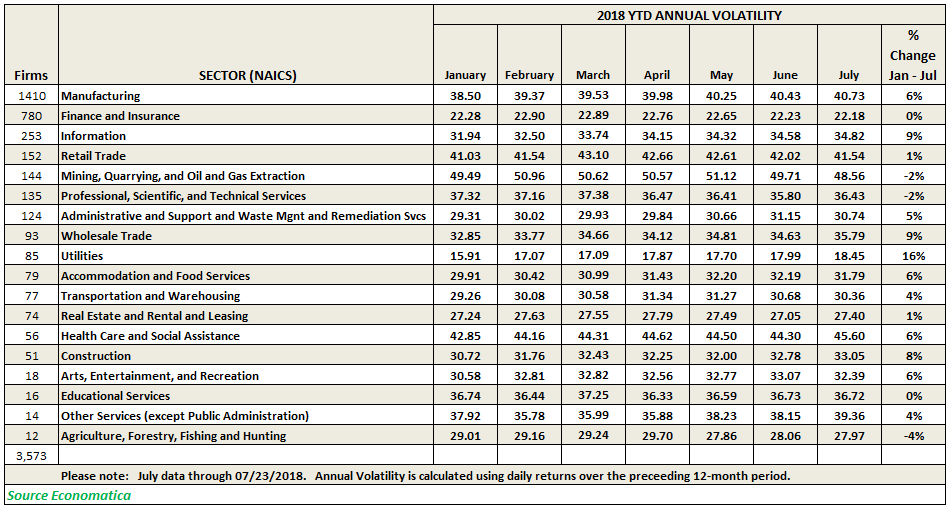

The data shows that volatility has risen modestly but steadily year to date for most sectors.
The Utilities industry, with 85 companies participating, saw the biggest increase in volatility, rising 16% since January. The Information and Wholesale Trade sectors were tied in second place, with 343 participants combined, each increasing by 9%. While in third place, the Construction sector, comprised of 51 participants increased 8% when compared to the beginning of the year.
Only three sectors have experienced drops in volatility this year. The Agriculture, Forestry, Fishing and Hunting sector, which is comprised by 12 participants, dropped 4% this year. The Mining, Quarrying, and Oil and Gas Extraction sector dropped 2%, matched by the Professional, Scientific, and Technical Services sector which also saw a decline of 2% since the beginning of the year. These 2 sectors combined represent 279 participants in the overall universe examined.
Please review the table below for further details.

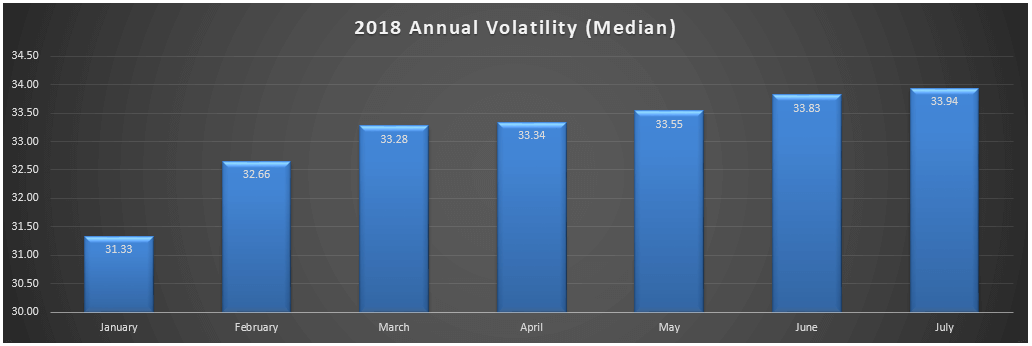
Using the Economatica system we aggregated these 18 sectors, a group comprised of 3,573 companies (traded on NYSE, NASDAQ and AMEX), and dug deeper into this trend in volatility and identified the median value for each month of 2018. It is clear, overall, volatility has indeed steadily risen modestly across the broader market.

The Economatica system has sophisticated analytic tools and comprehensive highly reliable financial data giving investment professionals the flexibility needed to identify trends, uncover potential opportunities, and manage risk. Find out more.
In this edition of Value Reports we examined the IPO market in the 1st half...
In this edition of Value Reports, we explore the Top 25 foreign stocks ranked by...
Using the Economatica system we calculated the EV/EBITDA (TTM) multiple for key sectors in the...