
Using the Economatica system to filter through our comprehensive stock database we discovered there were 162 IPOs in 2019. This is a move slightly down from 2018 when 189 IPOs were launched in the major exchanges. The data shows the IPO market remains fairly robust.
Here are a few general observations about this group before diving into the details of the top and bottom performing new stocks for 2019:
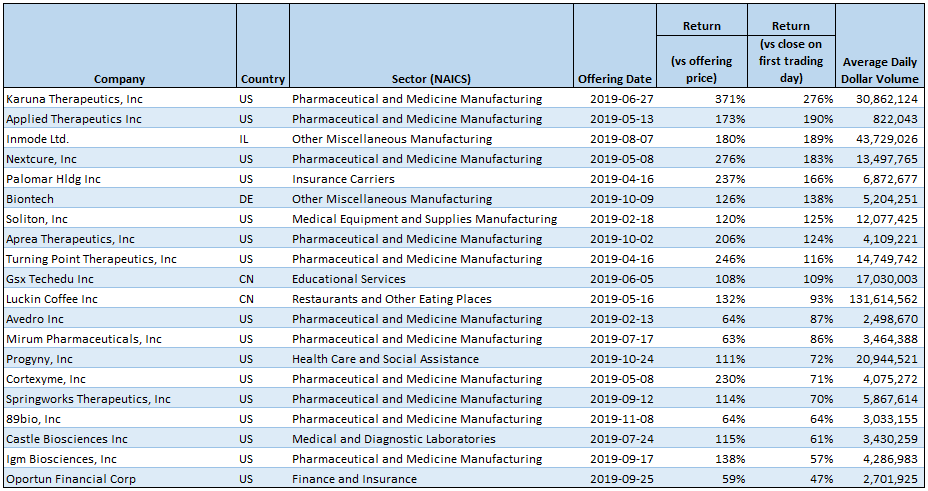
Among the best performing stocks launched in 2019 ten posted over a 100% return (versus the closing price on the first trading day). The top three best performers were Karuna Therapeutics, Applied Therapeutics, and Inmode Ltd. The best performing stock since its opening day was Karuna Therapeutics which returned 276% in 2019 since its debut on June 28th, or 371% versus its offering price on June 27th.
Sixteen of the top 20 IPOs in 2019 when ranked by returns are from the US, while 2 are from China, one from the Germany and one from the Israel.
Top 20 Best Performers
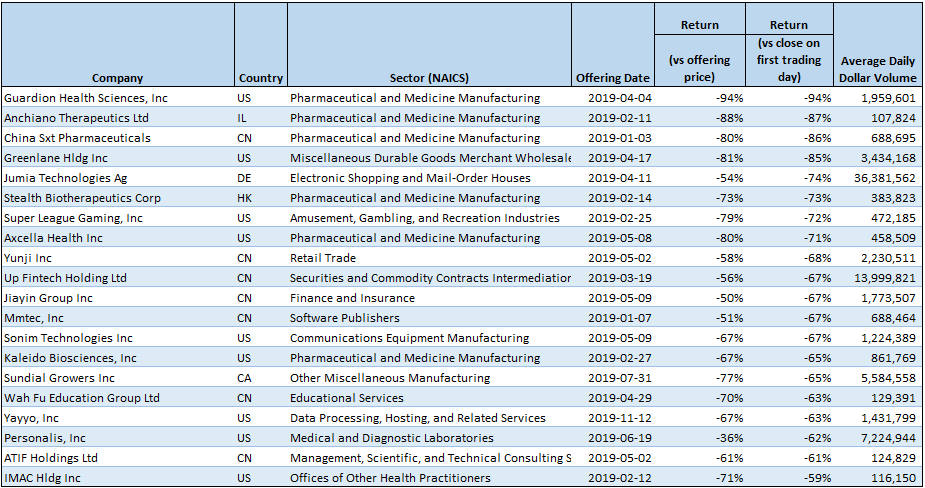
Looking at the worst performing companies the bottom 3 companies which disappointed investors the most are Guardion Health Sciences, Anchiano Therapeutics, and China SXT Pharmaceuticals. Guardion Health Sciences had the worst performance of the year, with a 94% drop in 2019.
Nine companies are from the US and eleven are foreign listings, including seven from China. The majority of companies (11) in this group are in the Pharmaceutical and Medicine Manufacturing industry.
Bottom 20 Performers
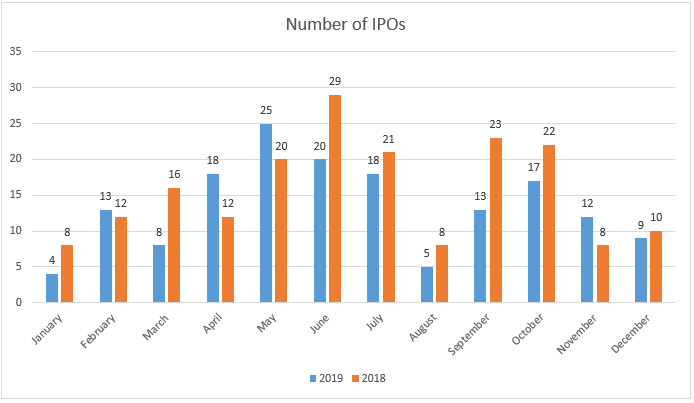
The highest number of IPOs was in the month of May, with 25 new stocks making their debut. In 2018, the highest number of IPOs was in the month of June, with 29 new listings. For the year 2019, the months of May and June each had 20 or more companies going public while the least busy months with 4 and 5 were January and August, respectively.
Please see the table below for details.
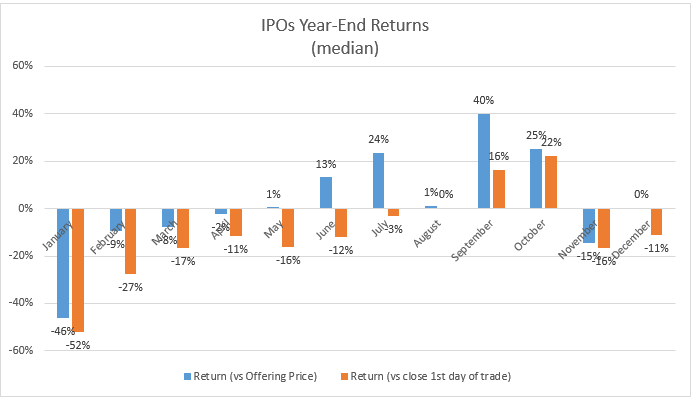
The chart below depicts the median return through the end of the year compared to offering price and closing price on first trading day.
The 13 IPOs listed in September 2019 was the best performing group, with a median return of 40% (versus offering price). On the flip side, the 4 IPOs listed in January 2019 was the worst performing group with a median return of negative 46%.
The Economatica system offers a range of sophisticated analytic tools and financial data on an easy to use online research platform that empowers asset managers, analysts, and other investment professionals who conduct fundamental and quantitative analysis. Ask us for a free 14-day trial today and learn how to make your own observations.

In this edition of Value Reports we examined the IPO market in the 1st half...

In this edition of Value Reports, we explore the Top 25 foreign stocks ranked by...

Using the Economatica system we calculated the EV/EBITDA (TTM) multiple for key sectors in the...