
The highest ROIC corresponds to the Semiconductor and Other Electronic Component Manufacturing sector (37.5%), followed by Software Publishers (17.2%). The semiconductor industry topping the list boasts a ROIC which is more than double the return of the second-place holder in the ranking.
On the flip side, the lowest ROIC corresponds to Electric Power, Generation, Transmission and Distribution, followed by Other Investment Pools and Funds, 4% and 5.2% respectively.
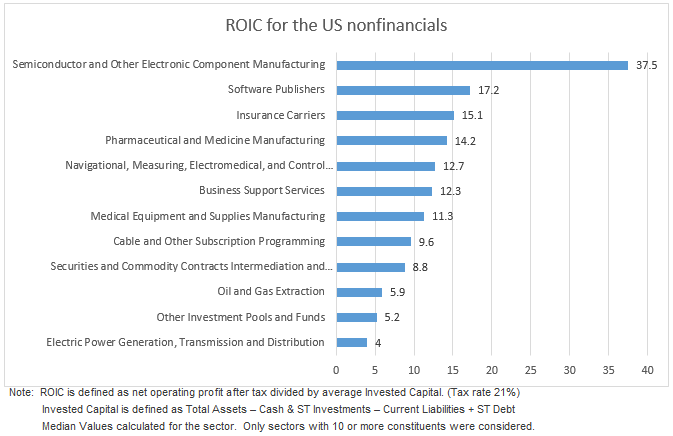
Return on Invested Capital (ROIC) is one of the most important measures of corporate performance. It represents the amount of profit generated for each dollar invested into the company by bondholders and stockholders. This is a crucial profitability ratio and a key indicator examined closely by investors.
For additional insight into these sectors’ performance, we used the Economatica system to illustrate the relationship between Enterprise Value/Invested Capital (EV/IC) and ROIC with the following scatter plot chart. EV/IC is an alternative version to the Price to Book Value ratio.
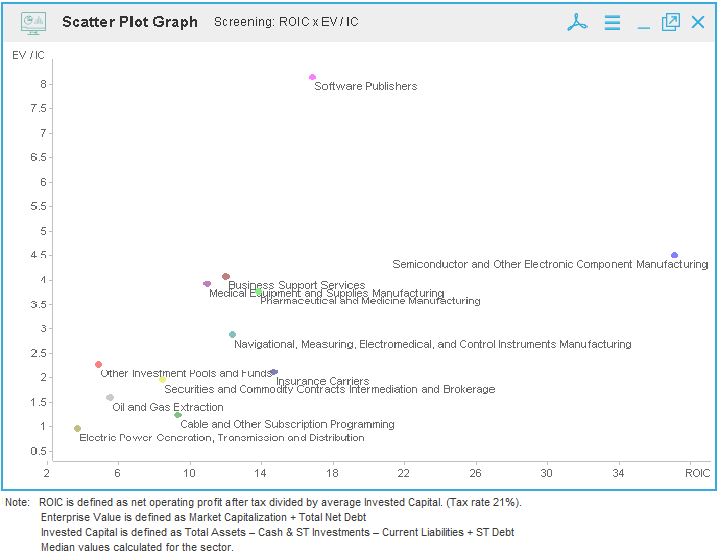
Economatica is an online investment research platform designed to facilitate deep fundamental and quantitative analysis. Asset managers, analysts, and other investment professionals have used Economatica for more than 30 years to research securities, identify opportunities, and make better investment decisions. To learn more please contact us.

In this edition of Value Reports we examined the IPO market in the 1st half...

In this edition of Value Reports, we explore the Top 25 foreign stocks ranked by...

Using the Economatica system we calculated the EV/EBITDA (TTM) multiple for key sectors in the...