Correlation Analysis via the Sector ETFs
Comparing a 1-year sector correlations matrix versus a 3-year sector correlations matrix across key sectors reveals shifts in inter-sector relationships
Using the Economatica system, we examined correlations across key sectors of the S&P 500 for both 1 year and 3 year periods.
To perform this comparison we chose the Spider Select Sector Group ETFs and used daily observations to generate the matrices.
For the purposes of this analysis and to put our observations into proper context we will define key sectors with a correlation of:
- Less than 0.3 as having a low correlation
- Between 0.3 and 0.7 as having a moderate correlation
- Greater than 0.7 as having a high correlation
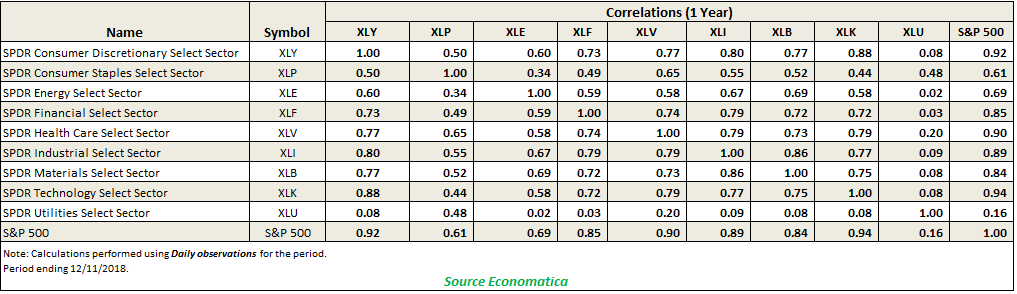
In examining the 1 Year Correlations matrix below we made the following observations for 9 key sectors:
- XLY, the Consumer Discretionary Sector, is moderately correlated to Consumer Staples and Energy; is highly correlated to the Financial, Health Care, Industrial, Materials and Technology sectors; and has a low correlation to Utilities (XLU).
- XLP, the Consumer Staples Select Sector, is moderately correlated to all sectors.
- XLE, the Energy Select Sector, is also moderately correlated to all sectors except Utilities, where there is a low correlation value of 0.02.
- XLF, the Financial Select Sector, is moderately correlated to Consumer Staples and Energy Sectors. It is highly correlated to Consumer Discretionary, Health Care, Industrial, Materials and Technology; and has a low correlation value with Utilities, of 0.03.
- XLV, the Health Care Select Sector, is moderately correlated to the Consumer Staples and Energy sectors; is highly correlated to Consumer Discretionary, Financial, Industrial, Materials and Technology; and has a low correlations value of 0.20 with Utilities.
- XLI, the Industrial Select Sector, is moderately correlated with Consumer Staples and Energy; is highly correlated to Consumer Discretionary, Financial, Health Care, Materials, and Technology; and has a low correlations value of 0.09 with Utilities.
- XLB, the Materials Select Sector, is highly correlated to the Consumer Discretionary, Financial, Health Care, Industrial, and Technology sectors; has a low correlation to Utilities; and is moderately correlated to Consumer Staples and Energy.
- XLK, the Technology Select Sector, is highly correlated to the Consumer Discretionary, Financial, Health Care, Industrial, and Materials sectors and is moderately correlated to the Consumer Staples, and Energy. It has a low correlation to Utilities.
- XLU, the Utilities Select Sector, has a low correlation to all the sectors except Consumer Staples.
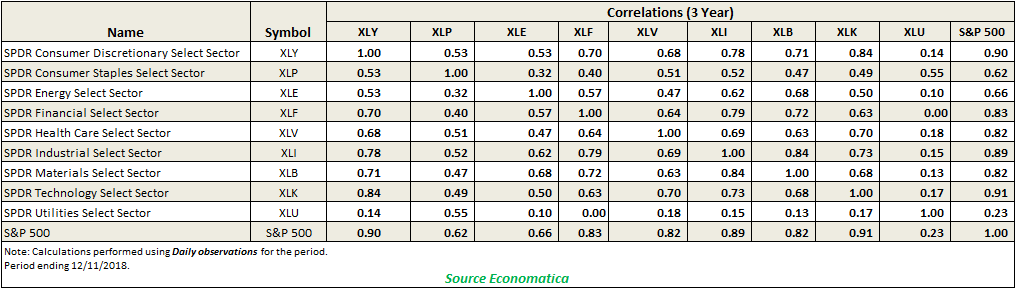
Taking a look now at the 3 Year Correlations matrix for these sectors we offer the following observations:
- XLY, the Consumer Discretionary Sector, is highly correlated to the Financial, Industrial, Materials, and Technology sectors; and moderately correlated to Consumer Staples, Energy, and Health Care. It has low correlation with Utilities.
- XLP, the Consumer Staples Select Sector, is moderately correlated to all 8 other sectors.
- XLE, the Energy Select Sector, is moderately correlated to all sectors except Utilities, with which it has a low correlation.
- XLF, the Financial Select Sector, is highly correlated to the Consumer Discretionary, Industrial, and Materials sectors; it is moderately correlated to Consumer Staples, Energy, Health Care, and Technology; and has a low correlation with Utilities.
- XLV, the Health Care Select Sector, is highly correlated to Technology; it has a low correlation to Utilities, and has a moderate correlation to the rest of the sectors.
- XLI, the Industrial Select Sector, is moderately correlated with Consumer Staples, Energy, and Health Care; is highly correlated to Consumer Discretionary, Financial, Materials, and Technology; and has a low correlation with Utilities.
- XLB, the Materials Select Sector, is highly correlated to the Consumer Discretionary, Financial, and Industrial sectors; has a low correlation to Utilities; and is moderately correlated to Consumer Staples. Energy, Health Care, and Technology.
- XLK, the Technology Select Sector, is highly correlated to the Consumer Discretionary, Health Care, and Industrial sectors and is moderately correlated to the Consumer Staples, Energy, Financial and Materials sectors. It has a low correlation to Utilities.
- XLU, the Utilities Select Sector, has a low correlation to all the sectors except Consumer Staples.
Economatica is an online investment research platform designed to facilitate deep fundamental and quantitative analysis. Asset managers, analysts, and other investment professionals have used Economatica for more than 30 years to research securities, identify opportunities, and make better investment decisions. To learn more please contact us.