
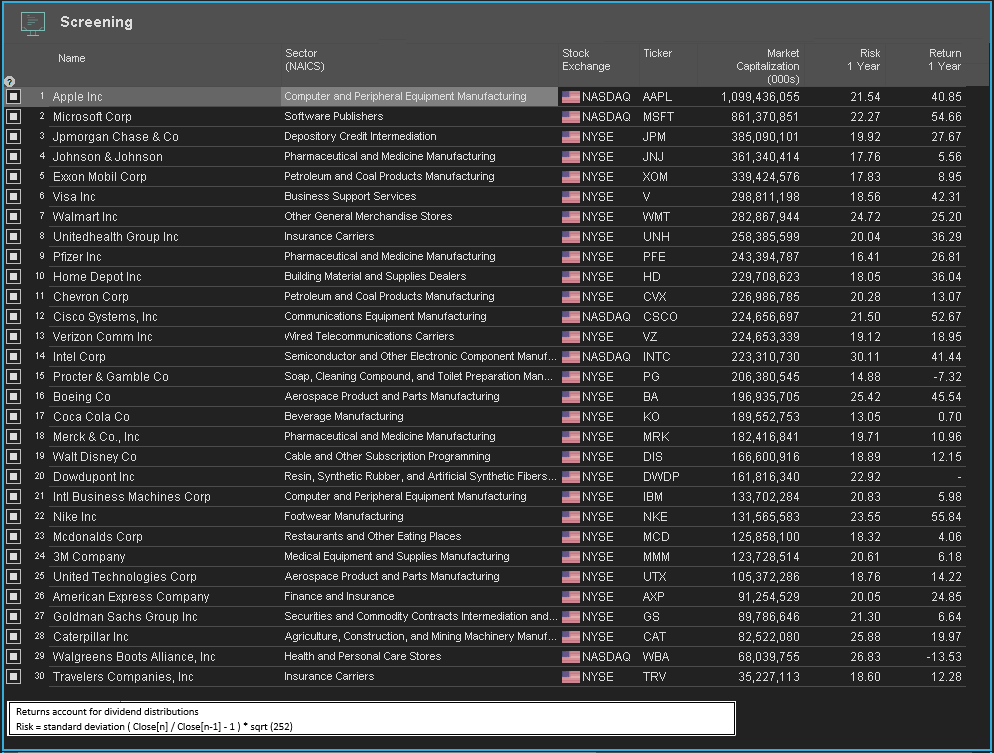
To highlight the risk-return of the Dow we ranked the 30 companies by market capitalization and, using the Economatica system, we calculated their 1-year risk return profiles and generated a scatter plot chart to visualize the results.
In the table below, the companies are ranked by market capitalization, from highest to lowest. All of the 30 stocks but 2 had positive 1 year returns, the exceptions being Procter & Gamble (-7.32%) and Walgreens (-13.53%). In terms of risk, 16 companies’ risk profile is greater than 20, and four of these are greater than 25 (Intel, Walgreens, Caterpillar and Boeing).
The three companies with the highest 1 year returns are: Nike (55.84%), Microsoft (54.66%),and Cisco Systems (52.67%). The 1 year risk for these companies are 23.55, 22.27, and 21.50, respectively.
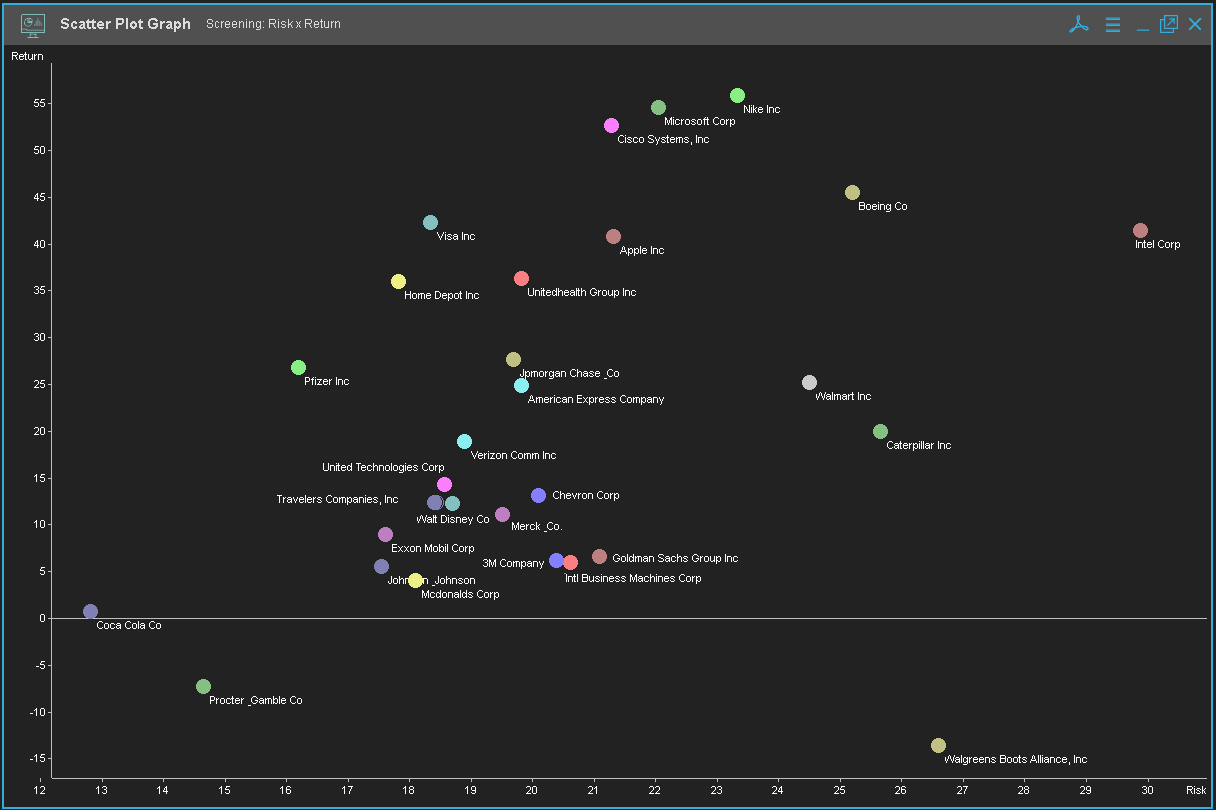
The analysis of risk-return is perhaps best depicted in a scatter plot chart as you can easily see which companies pose the least amount of risk (and usually lower returns) and those with the greatest amount of risk (and usually higher returns).
For example, the two companies with the least amount of risk are Coca-Cola and Procter & Gamble, 13.05 and 14.88 respectively. In contrast, Intel, Walgreens, and Caterpillar have the highest measure of risk, 30.11, 26.83, 25.88 respectively.
The Economatica system offers a range of sophisticated analytic tools and financial data on an easy to use online research platform that empowers asset managers, analysts, and other investment professionals to help you identify and examine potential opportunities. Ask us for a free trial today and learn how to make your own observations such as these.

In this edition of Value Reports we examined the IPO market in the 1st half...

In this edition of Value Reports, we explore the Top 25 foreign stocks ranked by...

Using the Economatica system we calculated the EV/EBITDA (TTM) multiple for key sectors in the...