
Aggregating by key sectors we aggregated the EPS results of 880 companies that have released their 1stquarter financials.
Using the Economatica system, we identified 880 companies out of 3,534 companies listed on major US exchanges (excluding foreign companies and ADRs) that have reported earnings for the preceding quarter. Let’s now examine the 1st quarter Earnings Per Share (EPS) numbers reported on the participating companies’ financial statements and compare them to the same quarter a year ago.
Now, although this figure represents only about 25% of the total universe of US companies, the market capitalization amounts to over 54% of the total universe. These companies also represent 17 key sectors of the market. The table below ranks Q1 2018 EPS from highest to lowest, compares it to the sector’s EPS from a year ago, and then we calculated the percent change for this period.
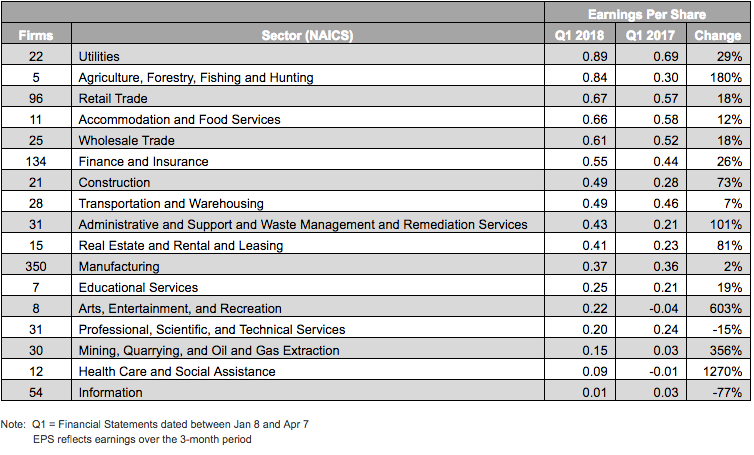
The sector with the highest EPS for Q1 2018 was Utilities (22 companies), which also ranked highest for the same period last year, increased its EPS by 29%. The Agriculture, Forestry, Fishing and Hunting sector, with just 5 companies participating, ranks second with EPS of $0.84, up 180% from last year. Retail Trade (96 companies) takes third place in the current ranking with EPS of $0.67, up 18% from Q1 2017.
The Healthcare and Social Assistance sector (12 companies), ranked 16th, saw its EPS jump 1,270% over last year. Arts, Entertainment, and Recreation, ranked 13th, saw a 603% increase in EPS, while the Mining, Quarrying, and Oil and Gas Extraction sector (30 companies), ranked 15th, increased its EPS 356%.
The two sectors with EPS less than the sector aggregate for Q1 2017 are Information (54 companies), down -77%, and Professional, Scientific, and Technical Services (31 companies), which dropped -15%.
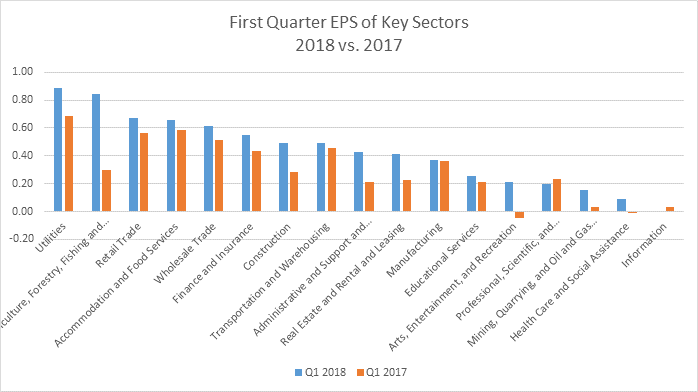
The following bar chart reiterates the observations described above, where variations between Q1 2018 and Q1 2017 are most apparent, such as the leap taken by EPS within the Agriculture, Forestry, Fishing and Hunting sector.
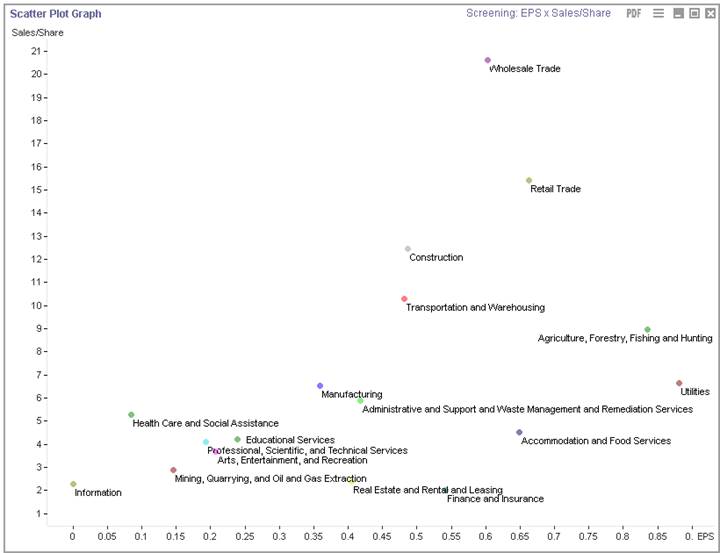
When you consider that revenues and EPS impact share prices it’s equally important to examine correlations between these two valuations. We used the Economatica system to highlight this correlation with the following scatter plot chart.
600 companies (69%) in our examination of Q1 2018 earnings reported higher EPS for this quarter than a year ago. In contrast, only 268 companies (31%) reported lower EPS for the same period. It will be interesting to see how these numbers change once the majority of companies report Q1 2018 earnings. This is how the numbers break down among the 17 key sectors and the 880 participating companies in this examination:
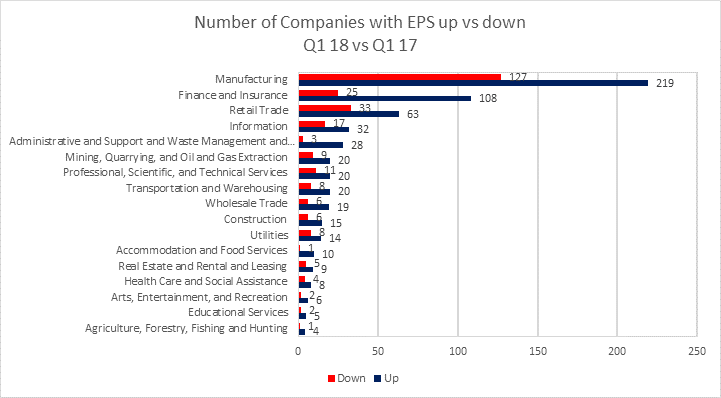
The sectors with the most companies reporting higher EPS for this past quarter compared to Q1 2017 are Manufacturing (219 versus 127), Finance and Insurance (108 versus 25), and Retail Trade (63 versus 33).
Economatica is an online investment research platform designed to facilitate deep fundamental and quantitative analysis. Asset managers, analysts, and other investment professionals have used Economatica for more than 30 years to research securities, identify opportunities, and make better investment decisions. To learn more please contact us.

In this edition of Value Reports we examined the IPO market in the 1st half...

In this edition of Value Reports, we explore the Top 25 foreign stocks ranked by...

Using the Economatica system we calculated the EV/EBITDA (TTM) multiple for key sectors in the...