
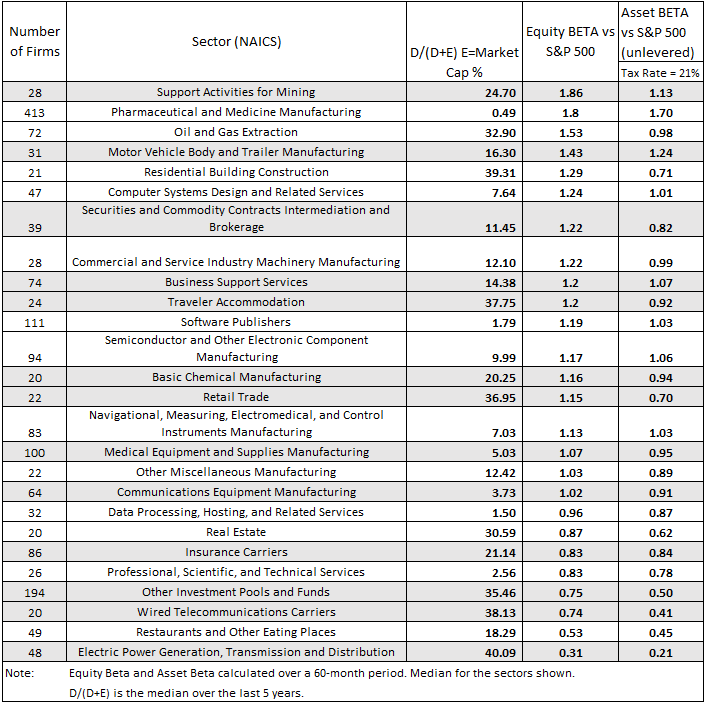
We used the Economatica system to calculate the Capital Structure (D/D+E)), Equity Beta (levered), and Asset Beta (unlevered) for all sectors comprised of 20 companies or more. In total, there were 1,768 companies traded on NYSE, Nasdaq, and Amex, sampled in this analysis.
The sectors with the highest Equity Beta are Support Activities for Mining and Pharmaceutical and Medicine Manufacturing, coming in at 1.86 and 1.8 respectively. The sectors with the highest Asset Beta is Pharmaceutical and Medicine Manufacturing, with a value of 1.70 considering the current corporate tax rate of 21%, followed by Motor Vehicle Body and Trailer Manufacturing with 1.24.
The sector with the lowest Equity Beta is Electric Power Generation, Transmission and Distribution, with 0.31, which also happens to be the sector with the lowest Asset Beta with 0.21.
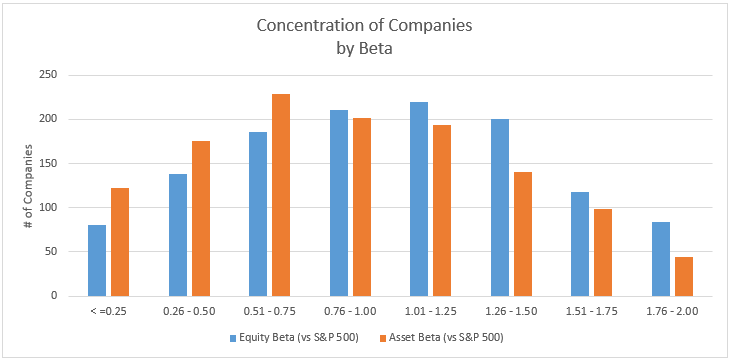
We also examine the concentration of companies by their Equity Beta and Asset Beta metrics. The chart below shows that the highest concentration of companies by both metrics combined are in the 0.76 – 1.0 beta range. Please see the chart below for additional details.
The Economatica system offers a range of sophisticated analytic tools and financial data on an easy to use online research platform that empowers asset managers, analysts, and other investment professionals who conduct fundamental and quantitative analysis. Ask us for a free trial today and learn how to make your own observations.

In this edition of Value Reports we examined the IPO market in the 1st half...

In this edition of Value Reports, we explore the Top 25 foreign stocks ranked by...

Using the Economatica system we calculated the EV/EBITDA (TTM) multiple for key sectors in the...