
The first half of February has exhibited very high levels of volatility after a prolonged period of relative calm.
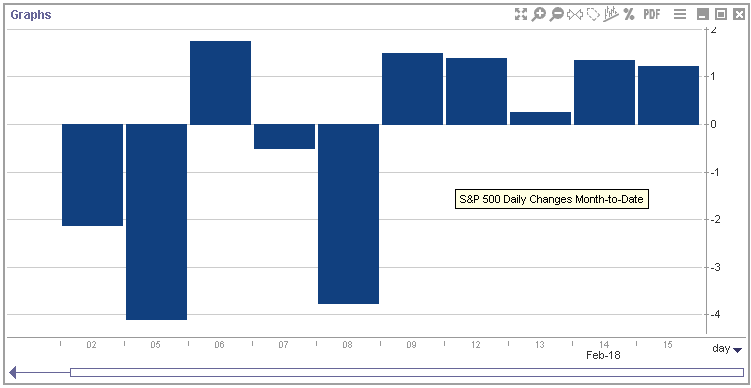
We used the Economatica system to examine the trading sessions for the first half of February and can see the S&P 500 has had eight sessions in February in which the index moved by more than 1% in either direction.
When you examine the bar chart below of daily returns, you can see there were three sessions to the downside exceeding 2%, two sessions down by more than 3%, and one session down over 4%. After a relatively calm start to 2018 the first half of February has certainly ratcheted volatility up a notch. In fact, these first 15 days have produced just as many sessions in which the index moved +/- 1% as in all of 2017!
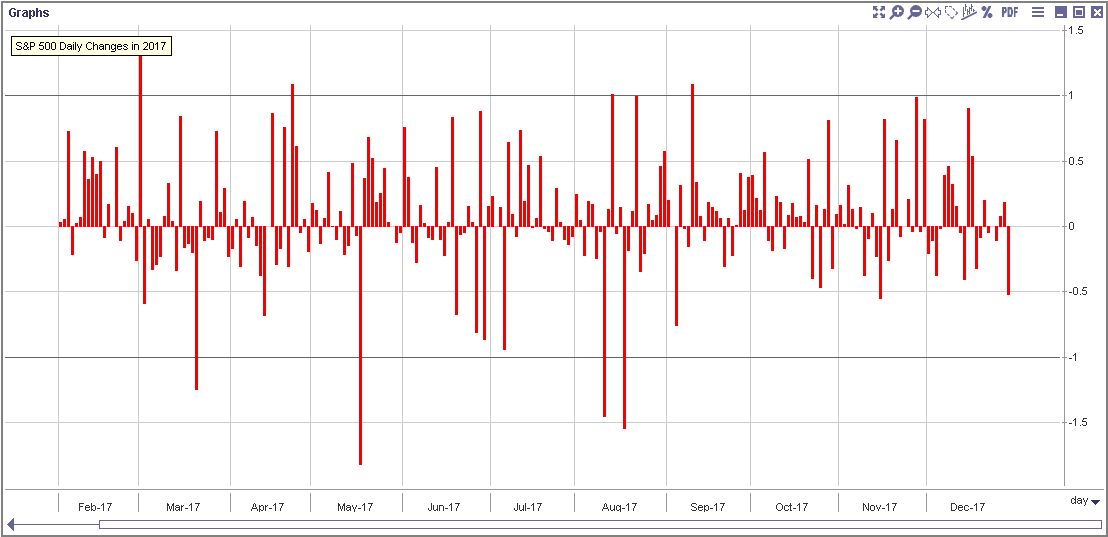
To illustrate this observation and help put this recent volatility into perspective we prepared the bar chart below with the Economatica system. You can see the S&P 500 had only 8 sessions in 2017 in which the index closed up or down with a variation in excess of 1% – the same exact number as have happened in the first 15 days of this February. These swings took place in February, March, April, May, August, and September of last year.
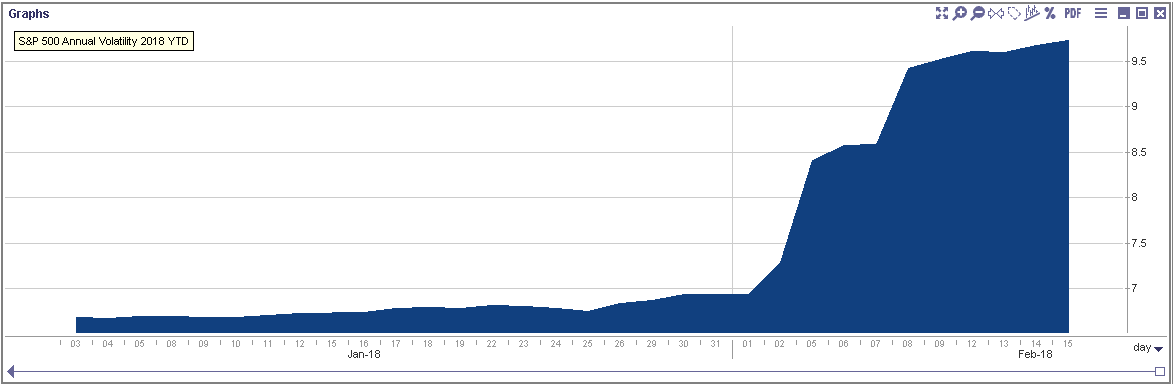
The Economatica chart below shows the annualized historical volatility of the S&P 500 since January 1 through February 15, 2018. The chart shows that volatility climbed rapidly over the first two weeks of this month. In stark contrast, January’s volatility was clearly less volatile.
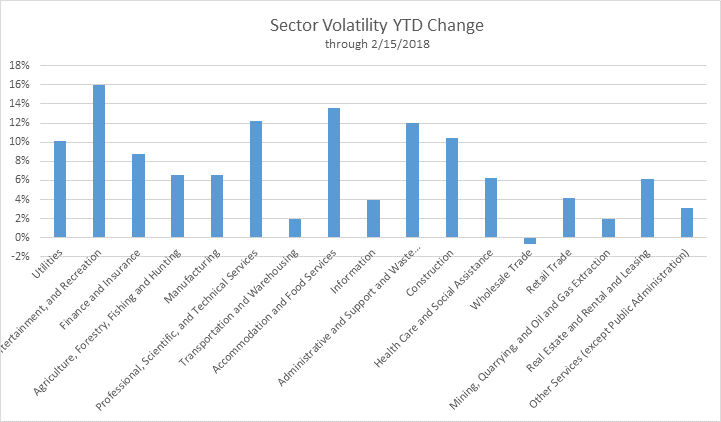
Using the Economatica system to examine sector volatility we identified that, with one exception only, volatility has risen across all the sectors of the S&P 500.
When you examine the sector volatility bar chart below, you can see the Wholesale Trade sector is relatively unchanged. Arts, Entertainment, and Recreation, and Accommodation and Food Services are the two sectors with the highest rise in volatility for the year to date.
The Economatica system helps asset managers, analysts, and other investment professionals conduct fundamental and quantitative analysis with a flexible, easy to use online research platform. Ask us for a free trial today and let us show you how.

In this edition of Value Reports we examined the IPO market in the 1st half...

In this edition of Value Reports, we explore the Top 25 foreign stocks ranked by...

Using the Economatica system we calculated the EV/EBITDA (TTM) multiple for key sectors in the...