
Using the Economatica system to filter through our comprehensive US financial data sets we discovered there were 93 IPOs in the 1st half (through June 30) of 2019.
Here are a few general observations about this group before diving into performance details of these new stocks for the first six months of 2019:
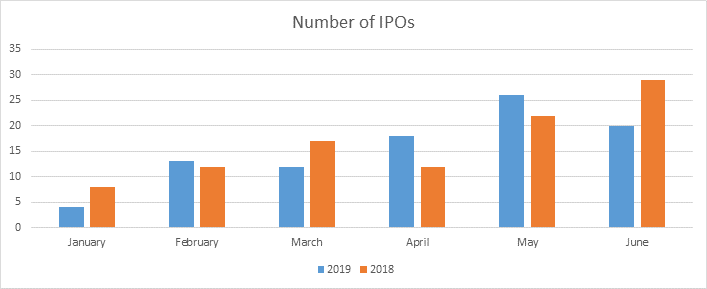
The following table is a list of IPOs for the first half of 2019 sorted by the first day of trading.
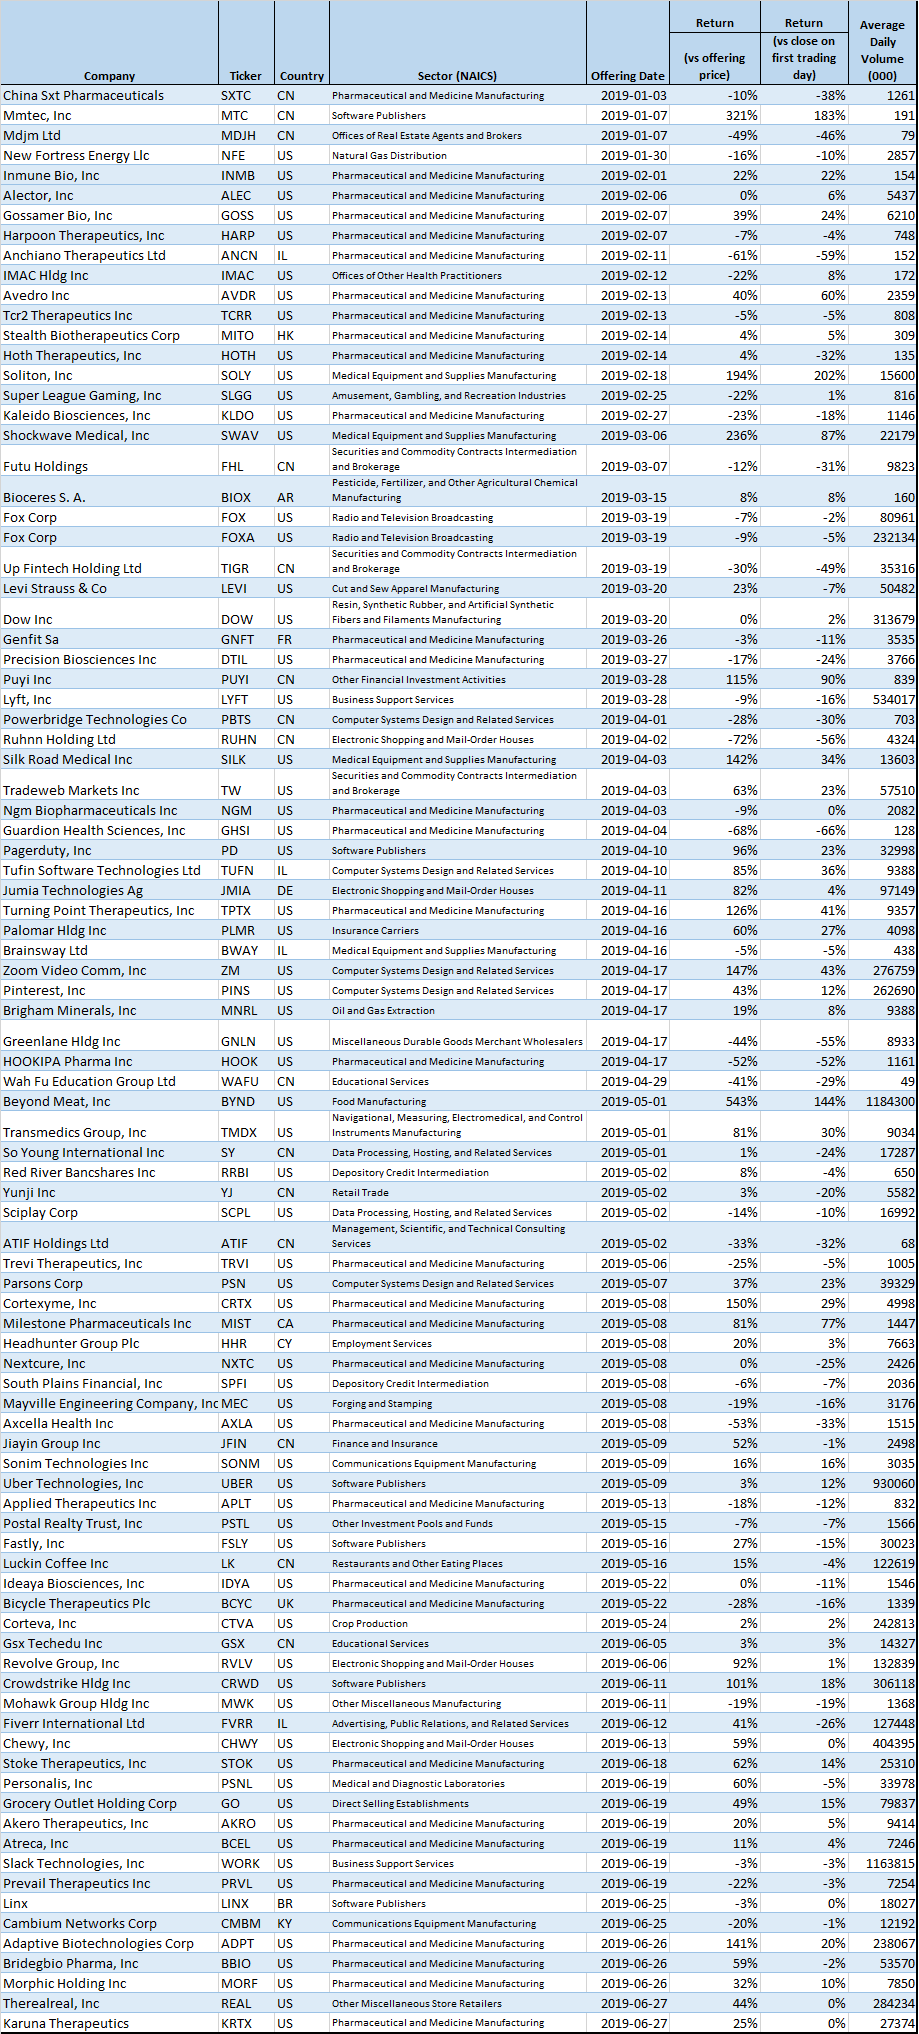
The chart below ranks the IPOs by Returns (through June 30) compared to their IPO price, from best 10 to worst 10 performers.
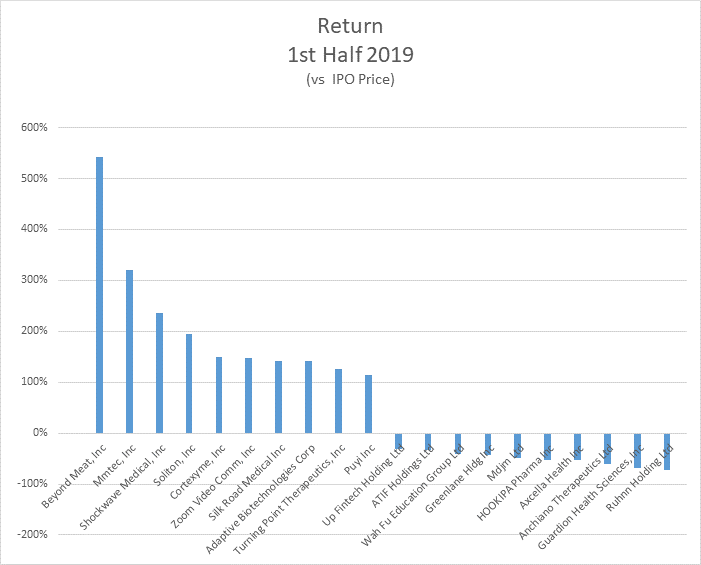
The chart below ranks the IPOs by Returns (through June 30) compared to the close on the first trading day, from best 10 to worst 10 performers.
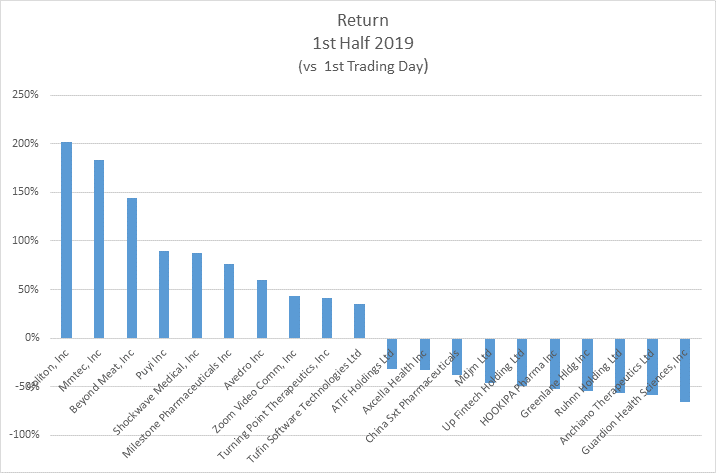
In the first half of 2019, we had 93 IPOs compared to 100 new issues in the same period for 2018. The highest number of IPOs was in the month of May, with 26 new stocks making their debut, compared to 22 in the same month last year.
The Economatica system offers a range of sophisticated analytic tools and financial data on an easy to use online research platform that empowers asset managers, analysts, and other investment professionals to help you identify and examine potential opportunities. Ask us for a free trial today and learn how to make your own observations.

In this edition of Value Reports we examined the IPO market in the 1st half...

In this edition of Value Reports, we explore the Top 25 foreign stocks ranked by...

Using the Economatica system we calculated the EV/EBITDA (TTM) multiple for key sectors in the...