
Using the Economatica system we examined a universe of 3,500 stocks and identified those that achieved new highs and lows during the week of April 22. Moreover, we decided to go farther back, examining the past 12, 24, 36, 48, and 60 months, to provide insights for the companies that have effectively made their 5 year, 4 year, 3 year, 2 year, and 1 year highs and lows. Then, we looked at increases in average daily volume to identify those stocks whose momentum might take their stock prices higher still.
In the table below we’ve summed up the total number of companies achieving new highs and lows for these periods.

There were 318 stocks realizing a new 52 week high over the last 12 months, or just 9.09% out of the universe of stocks included in this study. In contrast, 118 stocks reached a new 52 week low for the same period, or 3.37% of the sample examined.
Now, since traders will often interpret a new 52 week high as a buy signal, is this really enough information to make an investment decision? How else might they determine which stocks may have the momentum to carry their stock prices higher still? Let’s take a look at average daily volume.
The table below is an aggregate of those stocks of whose average daily volume for the week of April 22nd is more than double their average daily volume for the period of January 1, 2018 through the week ending on April 19th. We ranked the 34 stocks meeting our criteria by increase in average daily volume, highest to lowest.
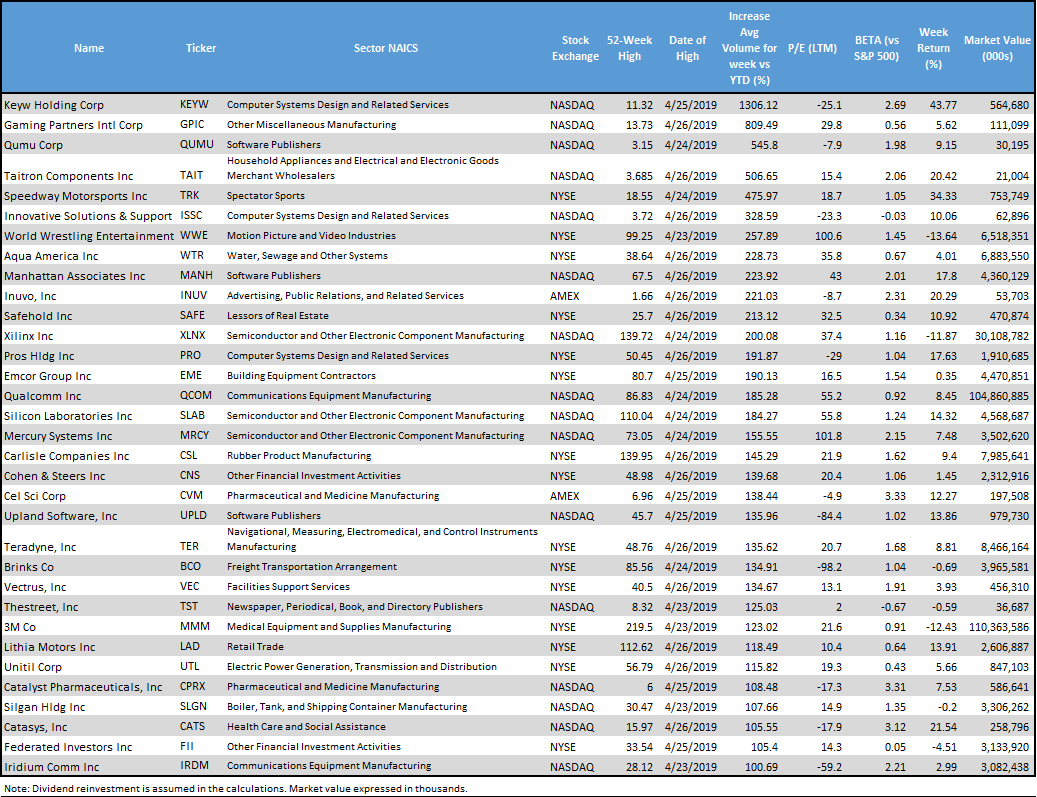
The stocks whose average daily volume has experienced a more than 5 fold increase over average daily volume for the period 1/1 through 4/19 include: Keyw Holding (13X+), Gaming Partners Intl Corp (8X+), Qumu Corp (5X+), and Taitron Components (5X+).
The two largest companies by far that made the cut in this select group of stocks are 3M Co and Qualcomm, whose market values exceed 100 billion.
The Economatica system has sophisticated analytic tools and comprehensive highly reliable financial data giving investment professionals, including traders, the flexibility needed to identify trends, uncover potential opportunities, manage risk, and make better decisions. Contact us to find out how.

In this edition of Value Reports we examined the IPO market in the 1st half...

In this edition of Value Reports, we explore the Top 25 foreign stocks ranked by...

Using the Economatica system we calculated the EV/EBITDA (TTM) multiple for key sectors in the...