
With most companies having already reported their fourth quarter 2018 financial statements, we used the Economatica system to aggregate all of the companies in the S&P 500 (excluding financials and insurance), as well as the general market (excluding finance and insurance), to determine Net Profit Margin over the last 12 months (LTM).
As clearly shown in the chart below, this important profitability metric shows a significant increase in 2018 – both for the S&P 500 companies and the general market (all companies traded on NYSE, Nasdaq, and Amex), except for the finance and insurance companies which were excluded from the sample for the purpose of this analysis.
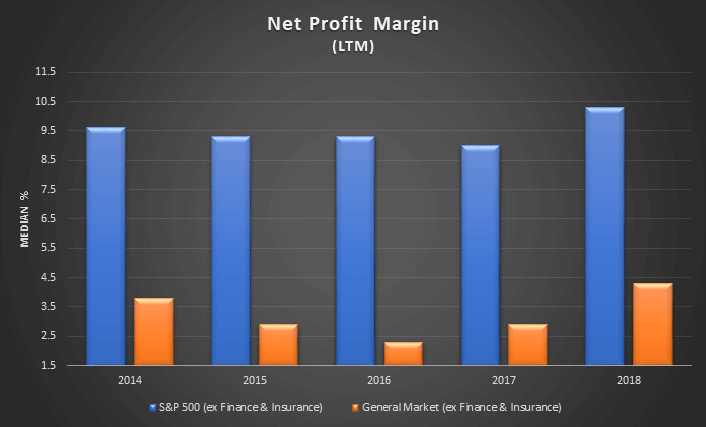
When we examine the median net margin (LTM) for the S&P 500 companies over the past 5 years, we make the following observations: the ratio dropped from 9.6% to 9.3% in 2015; remained stable in 2016 at 9.3%, but declined again in 2017 to 9%. The ratio then jumped significantly in 2018, increasing to 10.3%. This is the highest move we’ve seen in this metric in the last 5 years. This means these S&P companies made a profit of just over $0.10 for every dollar of revenue.
Using the same methodology we examined the general market. Let’s see how this metric has performed over the same five year period.
When we examined the median net margin (LTM) for the companies in the general market, we note net margin (LTM) dropped from 3.8% to 2.9% in 2015, further declined to 2.3% in 2016, but began its upward trend in 2017, increasing to 2.9% for the year and finally climbing all the way to 4.3% in 2018. This means the companies comprising the general market made a profit of $0.043 for every dollar of revenue.
The Economatica system offers a range of sophisticated analytic tools and financial data on an easy to use online research platform that empowers asset managers, analysts, and other investment professionals who conduct fundamental and quantitative analysis. Ask us for a free trial today and learn how to make your own observations.

In this edition of Value Reports we examined the IPO market in the 1st half...

In this edition of Value Reports, we explore the Top 25 foreign stocks ranked by...

Using the Economatica system we calculated the EV/EBITDA (TTM) multiple for key sectors in the...