
Stocks Achieving New 52 Week Highs or Lows during the Week of April 23, 2018
A new 52 Week High or Low tells investors a stock is trading at the highest or lowest price in the past 52 weeks. This important indicator is generally employed by investors in estimating the current value of a company and the trend its stock price is taking, either further upwards or downwards. Many equity traders take a new 52 Week High as a buy signal, believing momentum will drive the stock price ever higher, among other market factors.
Using the Economatica system we examined a universe of 4,400 stocks and identified those that achieved new highs and lows during the week of April 23. Moreover, we decided to go farther back, examining the past 12, 24, 36, 48, and 60 months, to provide insights for the companies that have effectively made their 5 year, 4 year, 3 year, 2 year, and 1 year highs and lows. Then, we looked at increases in average daily volume to identify those stocks whose momentum might take their stock prices higher still.
In the table below we’ve summed up the total number of companies achieving new highs and lows for these periods. Now, the number of companies achieving new high and lows the past 52 weeks (315 and 268), for example, is an aggregate of the stocks having surpassed prior multi-year highs or lows going back up to 60 months. So, this means there are 68 stocks that achieved a new 52 week high and 118 stocks that reached a new low over the past 12 months but did not achieve either a new high or low in any of the other preceding 12 month periods examined.
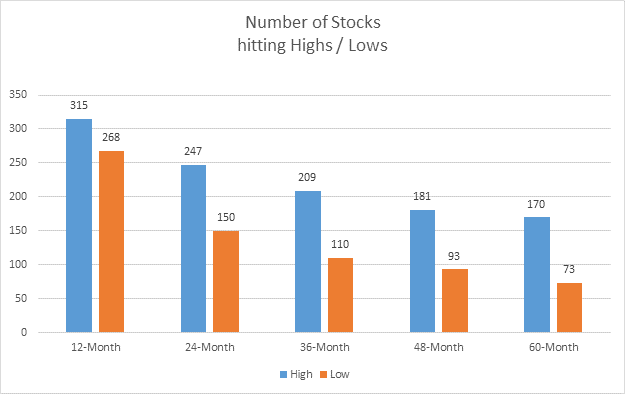
There were 315 stocks realizing a new 52 week high over the last 12 months, or just 7.16% out of the 4,400 stocks included in this study. In contrast, 268 stocks reached a new 52 week low for the same period, or 6.09% of the sample examined.
Now, since traders will often interpret a new 52 week high as a buy signal, is this really enough information to make an investment decision? How else might they determine which stocks may have the momentum to carry their stock prices higher still? Let’s take a look at average daily volume.
The table below is an aggregate of those stocks of whose average daily volume for the week of April 23rd is more than double their average daily volume for the period of January 1, 2018 through the week ending on April 20th. We ranked the 35 stocks meeting our criteria by increase in average daily volume, highest to lowest.
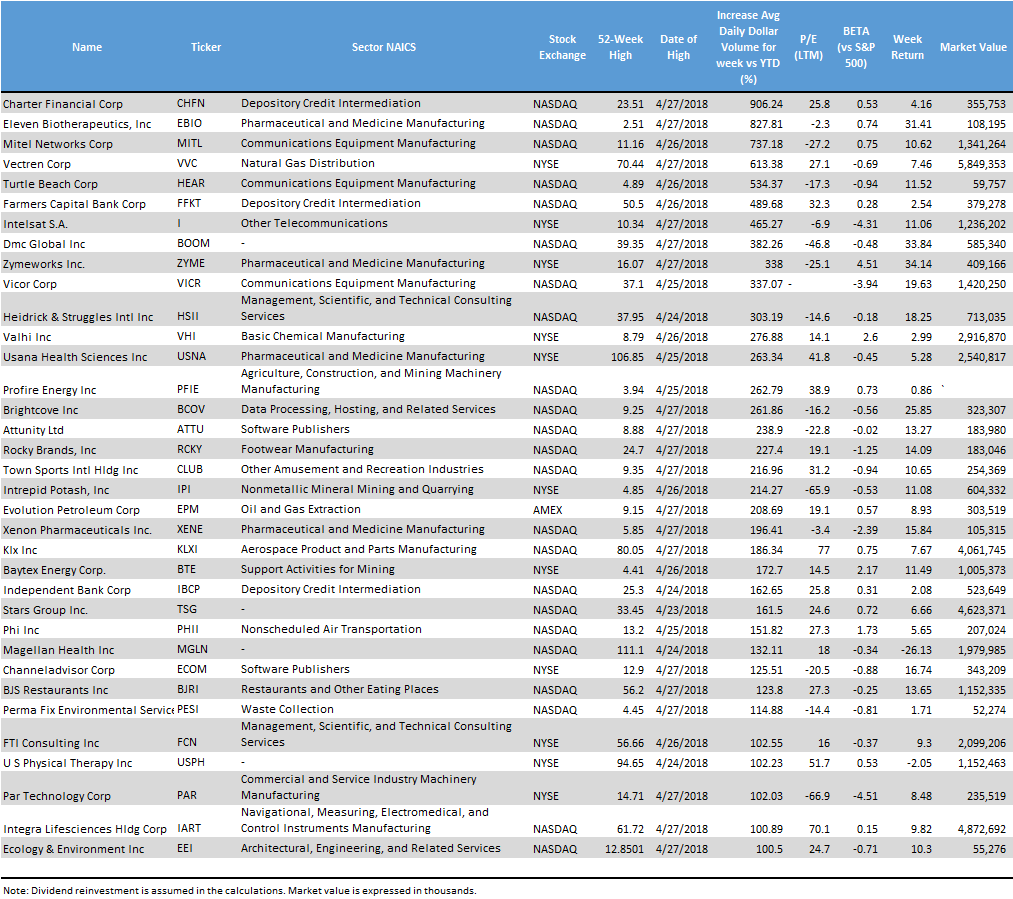
The stocks whose average daily volume has experienced a more than 5 fold increase over average daily volume for the period 1/1 through 4/20 include: Charter Financial Corp. (9X+), Eleven Biotherapeutics, Inc. ( 8X+), Mittel Networks Corp. (7X+), Vectren Corp. (6X+), and Turtle Beach Corp. (5X+).
The stocks whose average daily volume effectively doubled last week are FTI Consulting, Inc., US Physical Therapy, Inc., Par Technology Corp., Integra Lifesciences Holding Corp., and Ecology & Environment, Inc.
4 Pharmaceuticals, 3 Financials, and 3 Communication Equipment Manufacturers comprise nearly 29% of the 35 stocks making an impressive jump in volume the week they achieved new 52 week highs.
The Economatica system has sophisticated analytic tools and comprehensive highly reliable financial data giving investment professionals, including traders, the flexibility needed to identify trends, uncover potential opportunities, manage risk, and make better decisions. Contact us to find out how.

In this edition of Value Reports we examined the IPO market in the 1st half...

In this edition of Value Reports, we explore the Top 25 foreign stocks ranked by...

Using the Economatica system we calculated the EV/EBITDA (TTM) multiple for key sectors in the...