
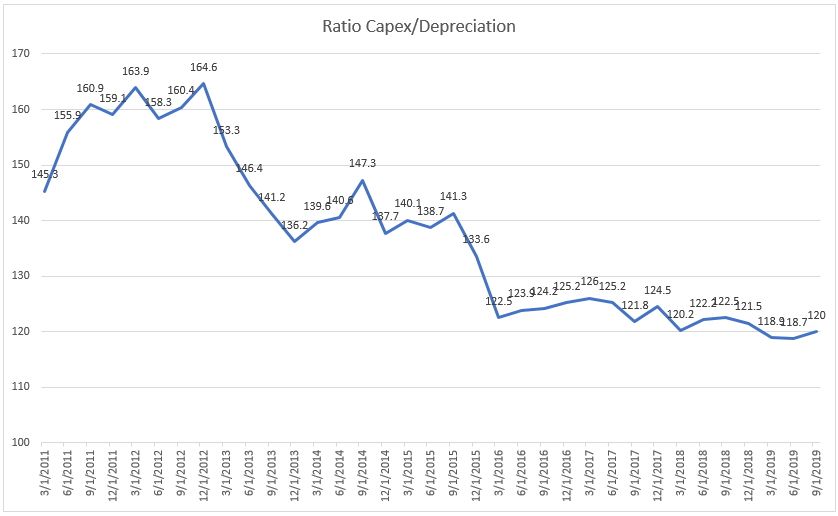
A review of the Capex to Depreciation ratio since 2011 shows a steady decline in this key metric but ticked higher in the last quarter.
We used the Economatica system to calculate the median capex to depreciation ratio for US publicly traded companies. The data clearly shows that the rate of investment by US companies has been declining steadily since 2011.
The highest peak in the period was achieved in the 4th quarter of 2012. The ratio climbed to a level of 164.6%. The lowest point observed in the 8 year period was in the 2nd quarter of 2019, when the capex to depreciation ratio hit the low point of 118.7%. The second lowest point belongs to the 1st quarter of 2019, 118.9%. While the metric rebounded slightly in the 3rd quarter of 2019 to 120%, it still remained relatively low and very close to the bottom range of values overall.
In the Economatica system, Capex is defined as Net PPE + Net Investments.
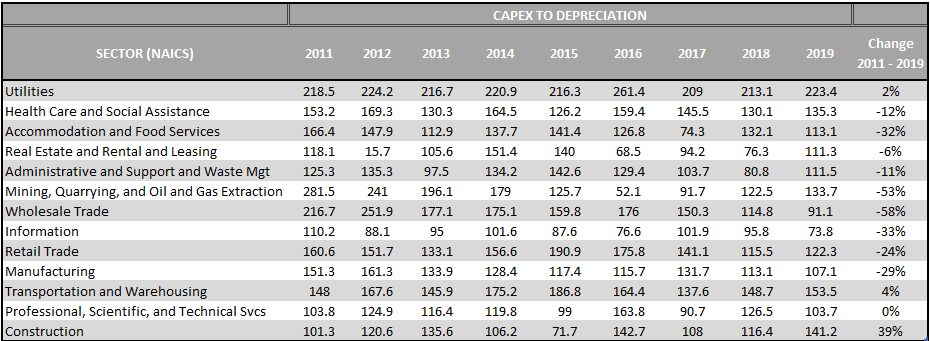
We break down the data to show the trends in individual sectors. The table below shows capex-to-depreciation by sectors, and all but three sectors experience declines in the metric.
The sector with the biggest drop in the rate of investment as measured by the capex to depreciation ratio is Wholesale Trade with a drop of 58% since 2011. The second largest drop belongs to Mining, Quarrying, and Oil and Gas Extraction dropping 53% since 2011.
The Economatica system offers a range of sophisticated analytic tools and financial data on an easy to use online research platform that empowers asset managers, analysts, and other investment professionals who conduct fundamental and quantitative analysis. Ask us for a free 14-day trial today and learn how to make your own observations.

In this edition of Value Reports we examined the IPO market in the 1st half...

In this edition of Value Reports, we explore the Top 25 foreign stocks ranked by...

Using the Economatica system we calculated the EV/EBITDA (TTM) multiple for key sectors in the...