
Although REITs have weathered the rising trend in interest rates (which started in Q4 2014) quite well, their returns have generally underperformed the market relative to the S&P 500. To illustrate the industry’s performance in this environment Economatica chose the Top 25 REITs ranked by Total Assets and examined several key metrics.
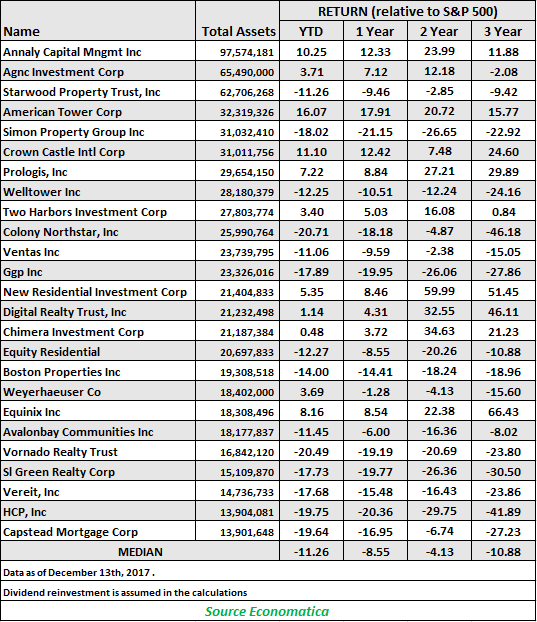
As can be observed from the 3-year table below the median returns for this group relative to the S&P 500 are negative for each period: YTD -11.26%, 1 Year -8.55%, 2 Year -4.13%, and 3 Year -10.88%. Clearly, when considered as a group, these 25 companies have underperformed the market since Q4 2014 and may give investors pause.
On an individual basis there are a handful of companies which have performed well despite the pressures of interest rates and other factors. The companies with the highest YTD returns relative to the S&P 500 are American Tower Corporation (16.07%), Crown Castle International (11.10%), and Annaly Capital Management (10.25%). More important are those companies which have outperformed the market since interest rates began to move upwards three years ago.
Taking first place is Equinix with a 3 year cumulative return relative to the S&P 500 of 66.43%. New Residential Investment Corporation takes second place with a return of 51.45% and Digital Realty Trust places third with 46.11%.
Given this underperformance over the past 3 years there is still no fundamental reason to panic.
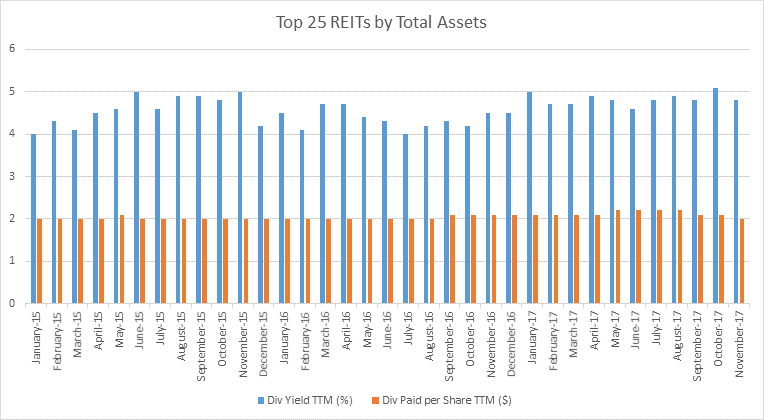
The Annual Dividend Yield and Dividend Paid per Share have remained stable and consistent throughout this period.
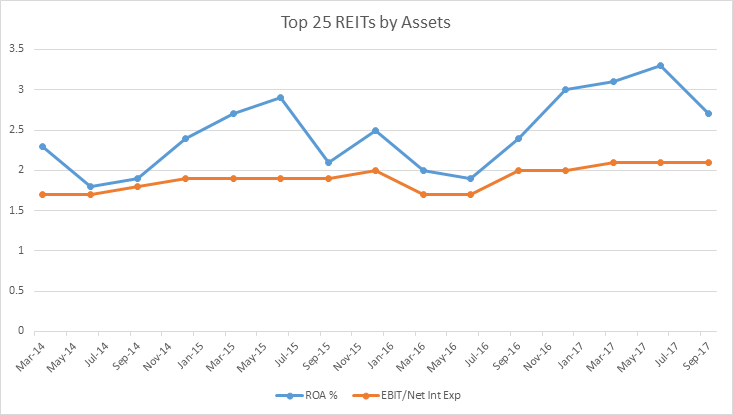
The indicators Return on Assets (ROA) and EBIT/Net Interest Expense, two key evaluation metrics for REITs, have also improved during this period.
Now, although REITs have historically produced a track record of strong performance, investors still have to examine the companies themselves and compare their valuation metrics against their peers.
You can use the Economatica system to generate your own observations. Ask us for a free trial.

In this edition of Value Reports we examined the IPO market in the 1st half...

In this edition of Value Reports, we explore the Top 25 foreign stocks ranked by...

Using the Economatica system we calculated the EV/EBITDA (TTM) multiple for key sectors in the...