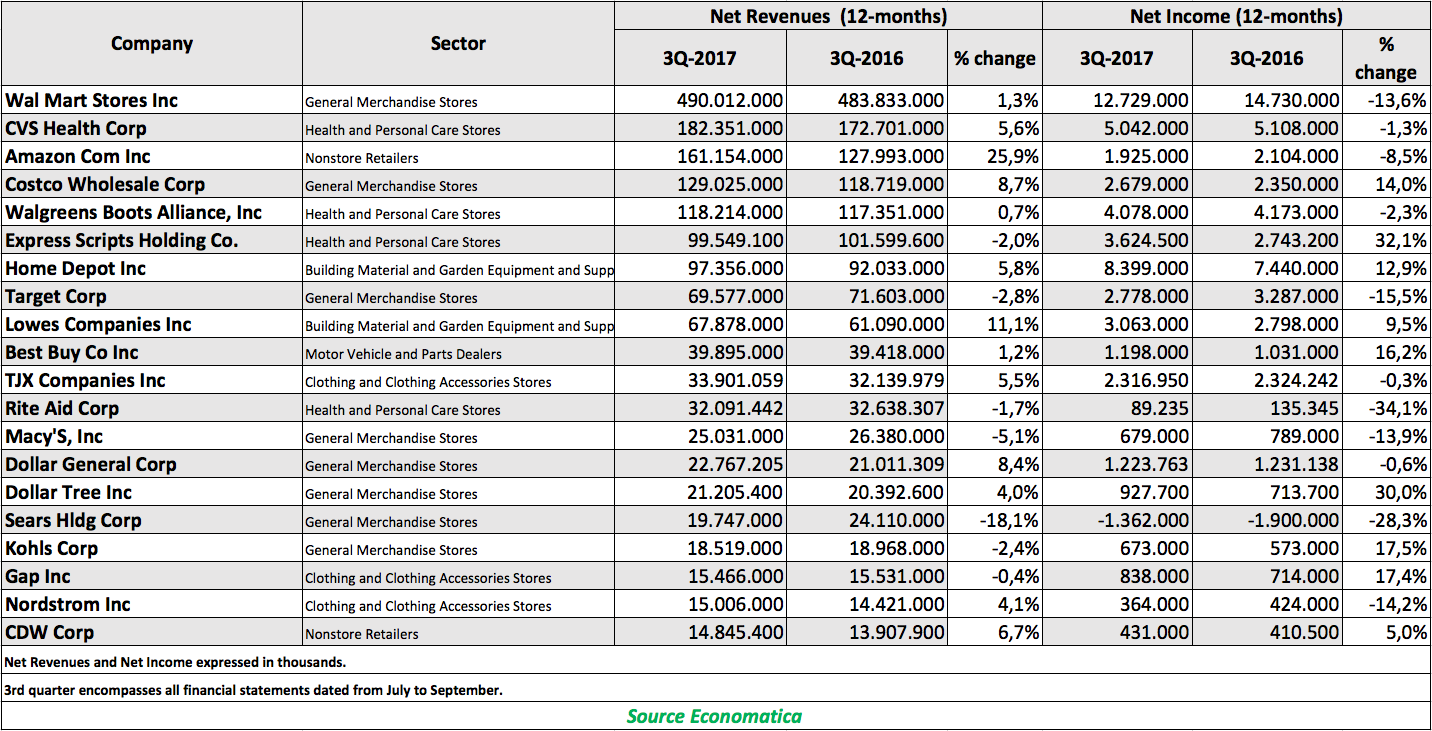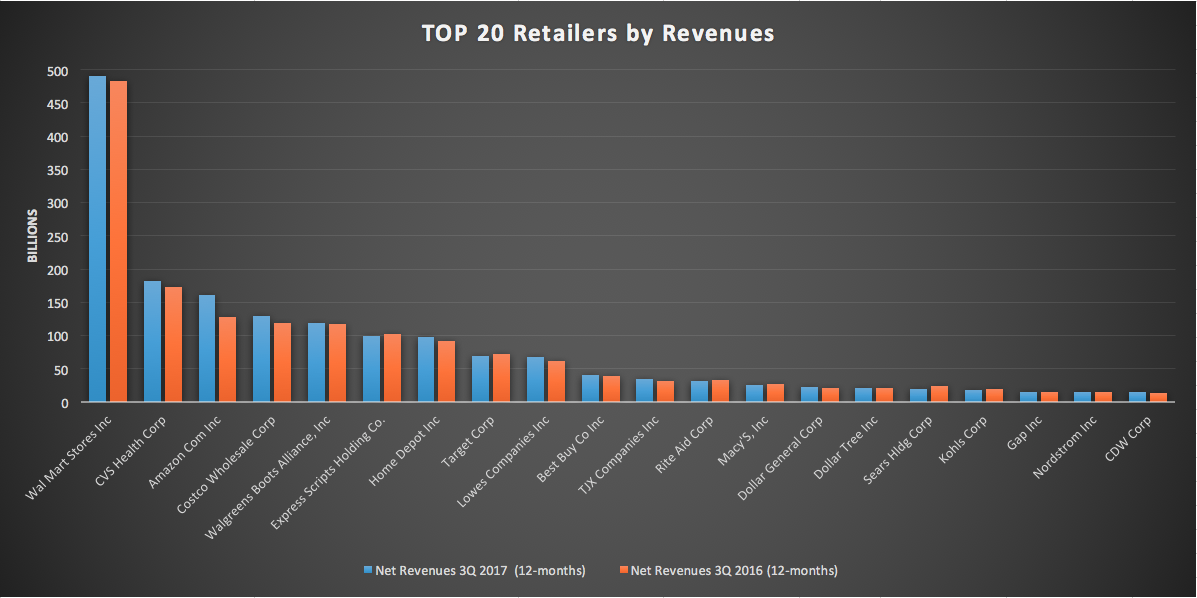

Comparing year-over-year results, we find that 7 out of the 20 experienced a drop in revenues. And it gets slightly worse when examining the bottom line, as 10 out of the 20 experience a drop in net income when comparing 3Q2017 with 3Q2016.
Amazon, the online retailer, is the leader on top line growth as it increased revenues by 26%. While its net income for the period, however, did not fare as well as it dropped 9%.
Sears Holding had the biggest drop in revenues in the period, dropping 18%. Its net income for the same period dropped a whopping 28%.
Rite Aid had the biggest decline in net income in the period with a drop of 34%.


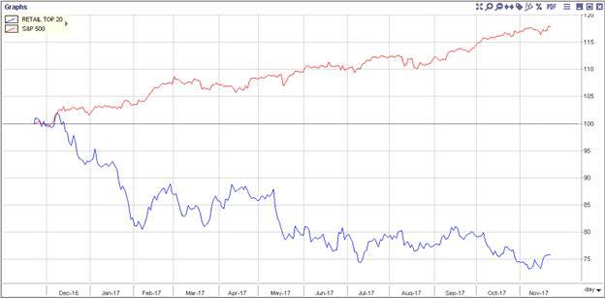
To illustrate the performance of these 20 retailers, we use the Economatica platform to create a basket with the 20 stocks of these companies and chart it versus the S&P 500 index. The chart shows how the group has significantly underperformed the S&P 500 over the last 12 months.
Note: Dividend reinvestment is assumed in calculating the Retail basket and equal weights were assigned to the constituents.

In this edition of Value Reports we examined the IPO market in the 1st half...
In this edition of Value Reports, we explore the Top 25 foreign stocks ranked by...
Using the Economatica system we calculated the EV/EBITDA (TTM) multiple for key sectors in the...