ROIC: S&P 500 Performance

ROIC: S&P 500 Performance in review

In this week’s value report, we used the Economatica platform to take a look at ROIC for key sectors of the S&P 500 index.

Return on Invested Capital (ROIC) is one of the most important measures of corporate performance. It represents the amount of profit generated for each dollar invested into the company by bondholders and stockholders. This is a crucial profitability ratio and a key indicator examined closely by investors.

The highest ROIC corresponds to the Semiconductor and Other Electronic Component Manufacturing sector, followed by Software Publishers. On the flip side, the lowest ROIC corresponds to Electric Power Generation, and Oil and Gas Extraction.
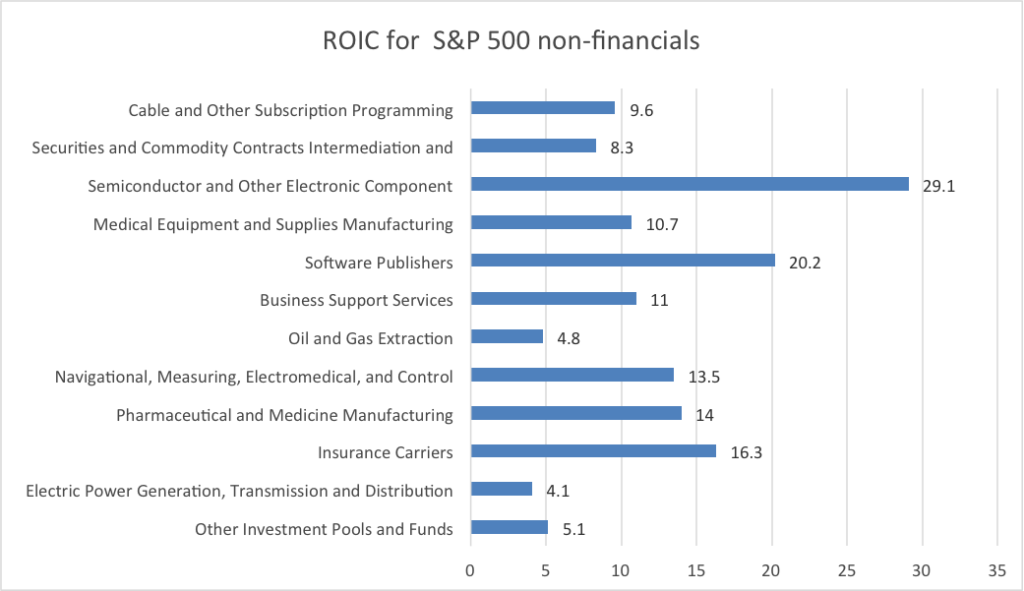
 

ROIC is defined as net operating profit after tax divided by average Invested Capital. (Tax rate 21%) Invested Capital is defined as Total Assets – Cash & ST Investments – Current Liabilities + ST Debt Median Values calculated for the sector.

For additional insight into these sectors’ performance, we used the Economatica system to illustrate the relationship between Enterprise Value/Invested Capital (EV/IC) and ROIC with the following scatter plot chart. EV/IC is an alternative version to the Price to Book Value ratio.
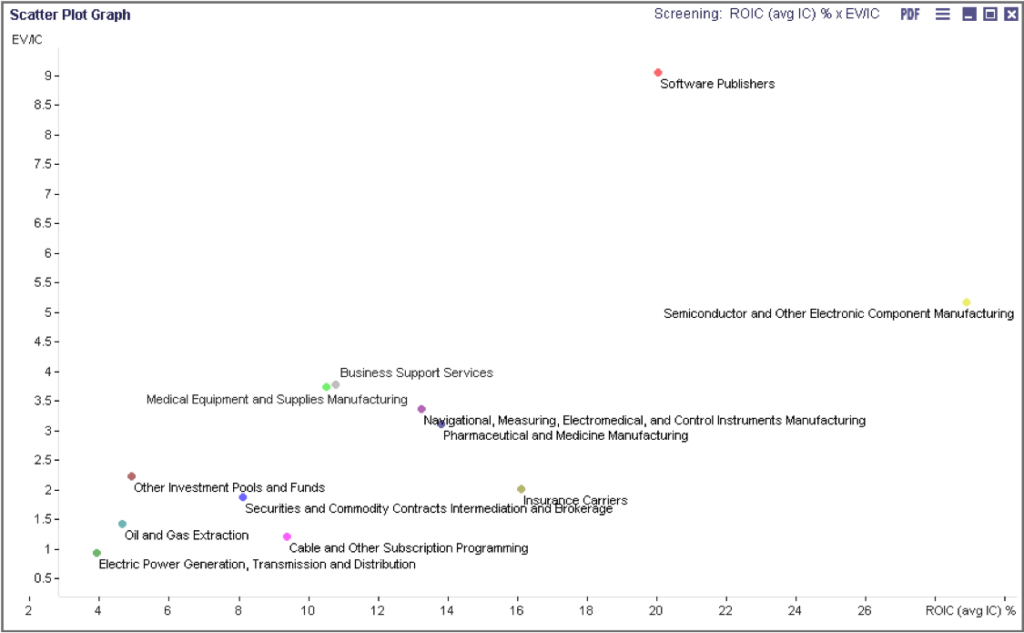
ROIC is defined as net operating profit after tax divided by average Invested Capital. (Tax rate 21%). Enterprise Value is defined as Market Capitalization + Total Net Debt Invested Capital is defined as Total Assets – Cash & ST Investments – Current Liabilities + ST Debt Median values calculated for the sector.


Economatica is an online investment research platform designed to facilitate deep fundamental and quantitative analysis. Asset managers, analysts, and other investment professionals have used Economatica for more than 30 years to research securities, identify opportunities, and make better investment decisions. To learn more please contact us.

Subscribe to our newsletter and receive our
exclusive content
as soon as it comes out

Related Posts

IPO Report for the 1st half of 2020

In this edition of Value Reports we examined the IPO market in the 1st half...

LEARN MORE

July 21, 2020 | Por Economatica

Most Popular Foreign Stocks according to Trading V…

In this edition of Value Reports, we explore the Top 25 foreign stocks ranked by...

LEARN MORE

June 30, 2020 | Por Economatica

EV/EBITDA Valuation Multiples of the S&P 500

Using the Economatica system we calculated the EV/EBITDA (TTM) multiple for key sectors in the...

LEARN MORE

April 16, 2020 | Por Economatica