Sector Correlations: impact Diversification
Sector Correlations
Comparing a 1-year sector correlations matrix versus a 3-year sector correlations matrix across key sectors reveals a trend to more moderate and lower correlations across sectors.
We used the Economatica system to examine correlations across key sectors of the S&P 500 for both 1 year and 3 year periods.
To perform this comparison we chose the Spider Select Sector Group ETFs and used daily observations to generate the matrices.
Our analysis demonstrates that correlations are more moderate and generally lower in the 1 year matrix than in the 3 year matrix. This trend towards lower correlations among key sectors could make a fund manager’s task of diversifying a portfolio easier as sectors have become less correlated with one another.
For the purposes of this analysis and to put our observations into proper context we will define key sectors with a correlation of:
- Less than 0.3 as having a low correlation
- Between 0.3 and 0.7 as having a moderate correlation
- Greater than 0.7 as having a high correlation
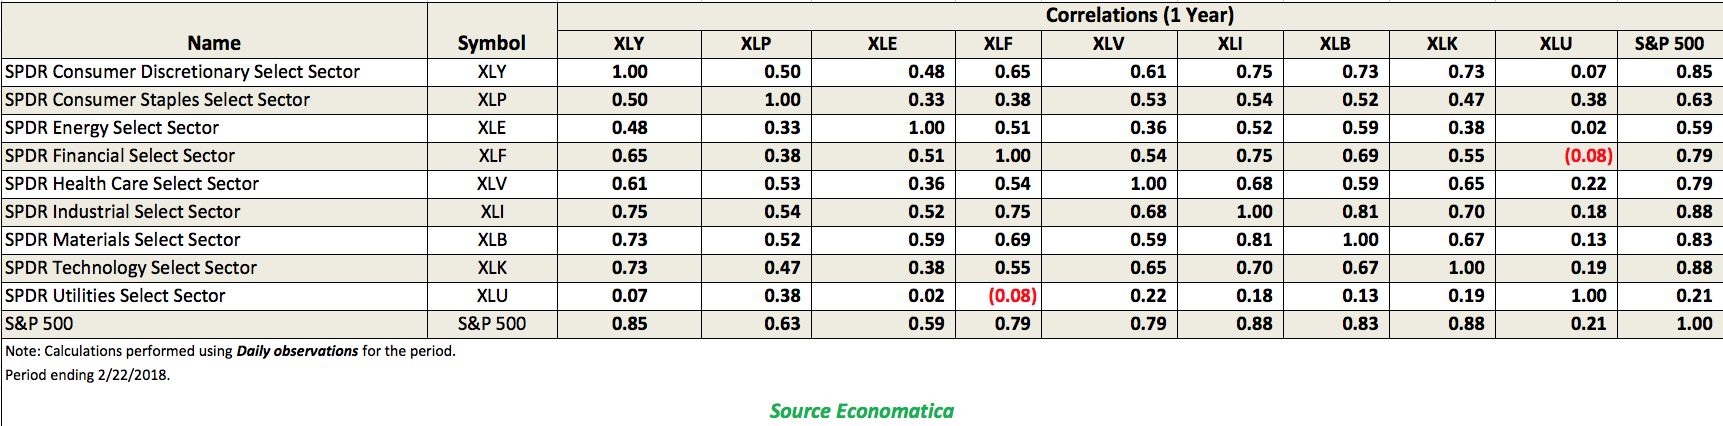
In examining the 1 Year Correlations matrix below we made the following observations for 9 key sectors:
- XLY, the Consumer Discretionary Sector, is moderately correlated to 4 sectors; is highly correlated to the Industrial, Materials, and Technology sectors; and has a low correlation to XLU.
- XLP, the Consumer Staples Select Sector, is moderately correlated to all sectors.
- XLE, the Energy Select Sector, is also moderately correlated to all sectors except XLU, where there is a low correlation value of 0.02.
- XLF, the Financial Select Sector, is moderately correlated to 6 sectors; has a high correlation value of 0.75 with the Industrial sector; and has a negative correlation value with Utilities, of (0.08).
- XLV, the Health Care Select Sector, is moderately correlated to 7 sectors; and has a low correlations value of 0.22 with Utilities.
- XLI, the Industrial Select Sector, is highly correlated with 4 sectors, among these are Consumer Discretionary, Financial, Materials, and Technology sectors; is moderately correlated to 2 sectors; and, again, like most of the other sectors, a low correlation with Utilities.
- XLB, the Materials Select Sector, is highly correlated to the Consumer Discretionary and the Industrial sectors, with values of 0.73 and 0.81, respectively; and is moderately correlated to 5 other sectors; and has a low correlation again with Utilities.
- XLK, the Technology Select Sector, is also highly correlated to the Consumer Discretionary and the Industrial sectors and their values are 0.73 and 0.70 respectively.
- XLU, the Utilities Select Sector, has the lowest correlation values with all sectors except the Consumer Staples sector, where it has a moderate correlation value of 0.38.
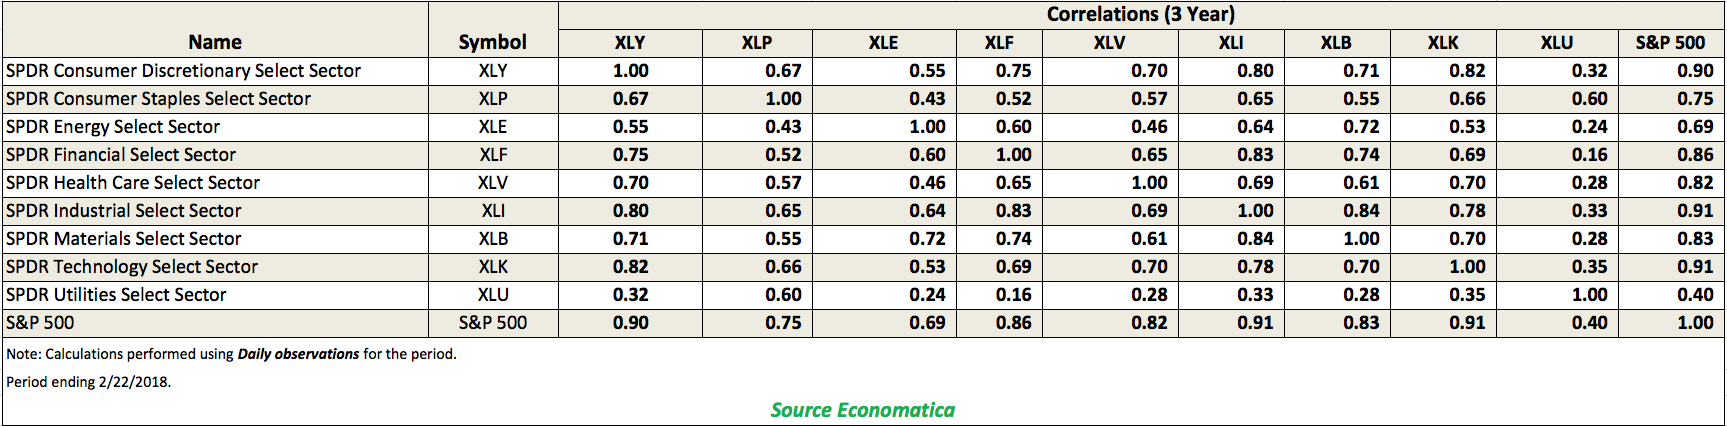
Taking a look now at the 3 Year Correlations matrix for these sectors we offer the following observations:
- XLY, the Consumer Discretionary Sector, is highly correlated to the Financial, Health Care, Industrial, Materials, and Technology sectors; and moderately correlated to 3 sectors.
- XLP, the Consumer Staples Select Sector, is moderately correlated to all 8 other sectors, with Consumer Discretionary having the highest value of the group.
- XLE, the Energy Select Sector, is highly correlated to the Materials sector, with a correlations value of 0.72; has a low correlation with Utilities; and is moderately correlated to the remaining 6 sectors.
- XLF, the Financial Select Sector, is highly correlated to the Consumer Discretionary, Industrial, and Materials sectors, with correlations values of 0.75, 0.83, and 0.74, respectively; also has a low correlation with Utilities; and is moderately correlated to the 4 remaining sectors.
- XLV, the Health Care Select Sector, is highly correlated to the Consumer Discretionary and Technology sectors, each with a correlations value of 0.70; is moderately correlated to 5 sectors; and has a low correlations value of 0.28 with Utilities.
- XLI, the Industrial Select Sector, is highly correlated with the Consumer Discretionary, Financial, Materials, and Technology sectors and their values are 0.80, 0.81, 0.84, and 0.78 respectively. And, the sector is moderately correlated with the other 4 sectors.
- XLB, the Materials Select Sector, is highly correlated to the Consumer Discretionary, Energy, Financial, Industrial, and Technology sectors; has a low correlation to Utilities; and is moderately correlated to the 2 remaining sectors, Consumer Staples and Health Care.
- XLK, the Technology Select Sector, is highly correlated to the Consumer Discretionary, Health Care, Industrial, and Materials sectors and is moderately correlated to the 4 other remaining sectors.
- XLU, the Utilities Select Sector, is moderately correlated to the Consumer Discretionary, Consumer Staples, Industrial, and Technology sectors and has a low correlation with the Energy, Financial, Health Care, and Materials sectors.
When comparing the two correlation matrices the most salient observation is that for each sector the 1 year correlation values are trending lower across the board. The only exception is the correlation between the Consumer Discretionary and Materials sectors. In this one example only is the 1 year value higher than the 3 year, 0.73 compared to 0.71.
The Economatica system empowers asset managers, analysts, and other investment professionals who conduct fundamental and quantitative analysis with a range of sophisticated analytic tools and financial data available on an easy to use online research platform. Ask us for a free 14-day trial today and let us show you how.