
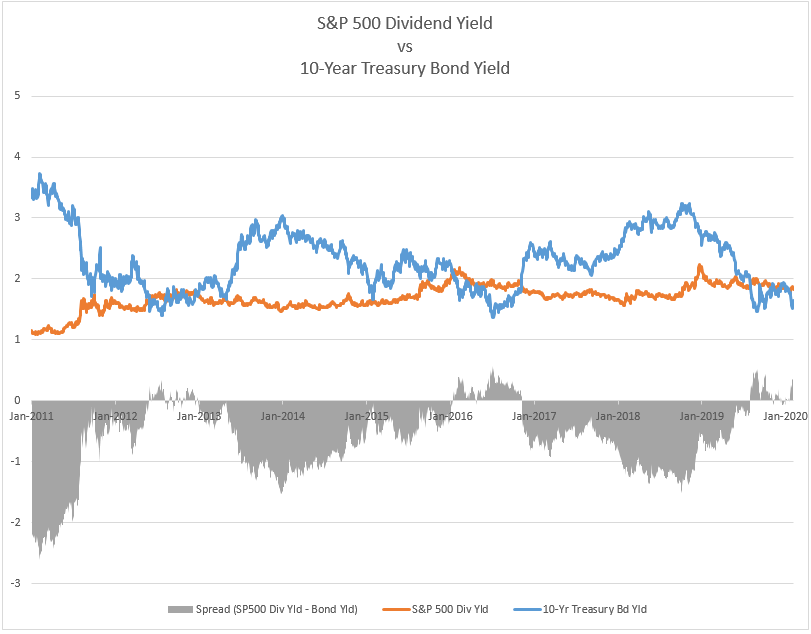
We used the Economatica system to examine the relationship between the 10-year bond yield and the S&P 500 dividend yield currently and over the past few years.
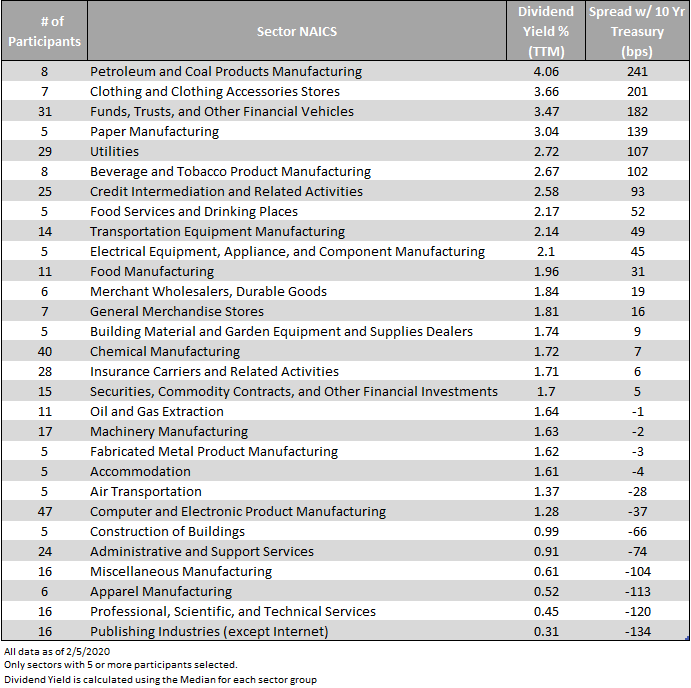
The data we’ve gathered reveals 17 sectors in the S&P 500 have dividend yield higher than the current 10-year bond yield. Highlighting the top 4 sectors – Petroleum and Coal Products Mfg. (4.06%), Clothing and Clothing Accessories Stores (3.66%), Funds, Trusts, and Other Financial Vehicles (3.47%), and Paper Manufacturing (3.04%) are posting dividend yields with spreads ranging from 241 bps to 139 bps over the current yield of the 10-year bond (1.65%).
The other 12 sectors examined in the S&P 500 have a median dividend yield below the 10-year bond yield.
One year ago, at the close of January 2019, the 10-year bond had a yield of 2.64% and only 7 sectors in the S&P 500 posted median dividend yields that were higher at the time.
Please review the table below for more details.
The chart below highlights the different points over the last 9 years in which the yield-gap has inverted.
Economatica is an online investment research platform designed to facilitate deep fundamental and quantitative analysis. Asset managers, analysts, and other investment professionals have used Economatica for more than 30 years to research securities, identify opportunities, and make better investment decisions. To learn more please contact us.

In this edition of Value Reports we examined the IPO market in the 1st half...

In this edition of Value Reports, we explore the Top 25 foreign stocks ranked by...

Using the Economatica system we calculated the EV/EBITDA (TTM) multiple for key sectors in the...