
Using the Economatica system we calculated the EV/EBITDA (TTM) multiple for key sectors in the S&P 500.
The multiple derived by the ratio between Enterprise Value (EV) and EBITDA is known as the Enterprise Multiple. This multiple is used by analysts to determine the value of a company, whether it’s undervalued or overvalued, or even a suitable M&A candidate. The multiple is particularly useful because, unlike P/E, for example, it is capital structure neutral allowing for fairer comparisons of companies with varying levels of debt. The multiple also removes any effects of noncash expenses on a company’s value, too. A low enterprise multiple might indicate a company is undervalued and also possibly an attractive takeover target. A high value might indicate the company is overvalued and also then less likely to be an M&A target.
As with many valuation metrics useful in determining a company’s value the Enterprise Multiple can vary by sector. Expect higher enterprise multiples in high-growth industries, such as technology, and lower multiples in industries with slower growth, such as utilities.
For the purposes of this report we selected sectors in the S&P 500 comprised of 5 or more companies after eliminating companies with negative EBITDA (TTM) from the sample. The table below is ranked by EV-to-EBITDA (TTM) multiple from lowest to highest through 3/30/2018, or, as one might infer, from the least to most expensive sectors.
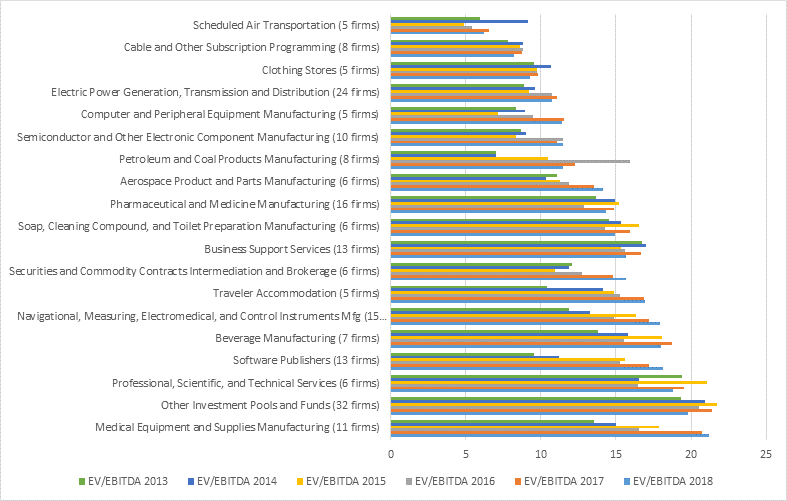
* EV/EBITDA per sector is calculated by dividing the total enterprise value of the sector by the total sum of the 12-month EBITDA of the companies. EV/EBITDA 2018 is calculated using the enterprise value of 3/30/2018. All other year ends (2013 – 2018) are calculated using the enterprise value of 12/31. ***The Other Investment Pools and Funds sector is comprised mainly of REITs.
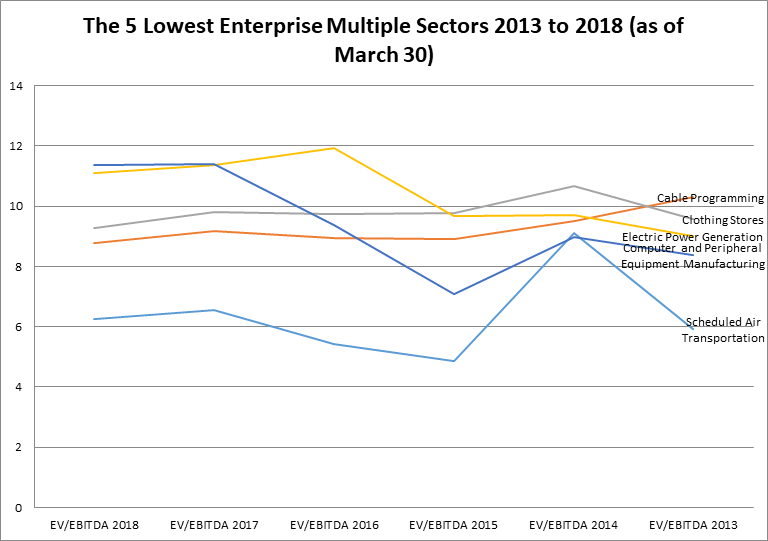
The 5 sectors with the lowest Enterprise Multiple for 2018 in this ranking are Scheduled Air Transportation (6.24), Cable Programming (8.78), Clothing Stores (9.26), Electric Power Generation (11.11), and Computer & Peripheral Equipment Manufacturing (11.35).
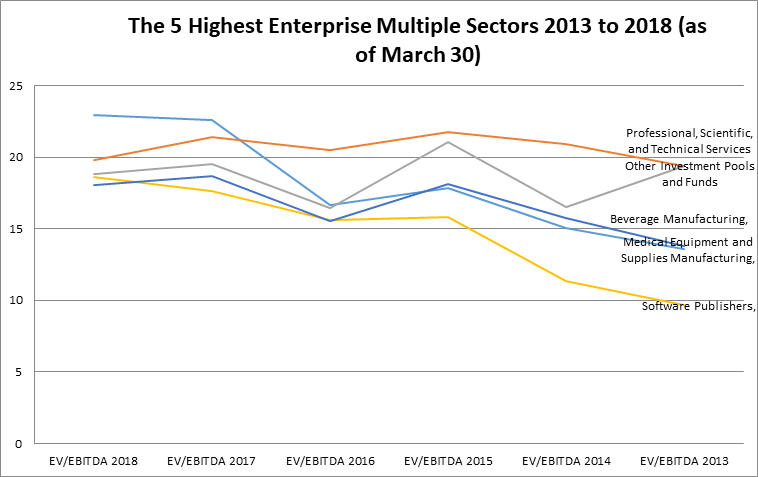
We then identified the 5 most expensive sectors (as of March 30, 2018 ) on the higher end of the Enterprise Multiple spectrum. These are the Medical Equipment and Supplies Manufacturing (22.92), Other Investment Pools and Funds (19.81), Professional Scientific and Technical Services (18.79), Software Publishers (18.62), and Beverage Manufacturing (18.02).
** EV/EBITDA per sector is calculated by dividing the total enterprise value of the sector by the total sum of the 12-month EBITDA of the companies. EV/EBITDA 2018 is calculated using the enterprise value of 3/30/2018. All other year ends (2013 – 2018) are calculated using the enterprise value of 12/31. ***The Other Investment Pools and Funds sector is comprised mainly of REITs.
The Economatica system offers a range of sophisticated analytic tools and financial data on an easy to use online research platform that empowers asset managers, analysts, and other investment professionals who conduct fundamental and quantitative analysis to identify and examine opportunities. Ask us for a free trial today and learn how to make your own observations.

In this edition of Value Reports we examined the IPO market in the 1st half...

In this edition of Value Reports, we explore the Top 25 foreign stocks ranked by...

Using the Economatica system we calculated the EV/EBITDA (TTM) multiple for key sectors in the...