
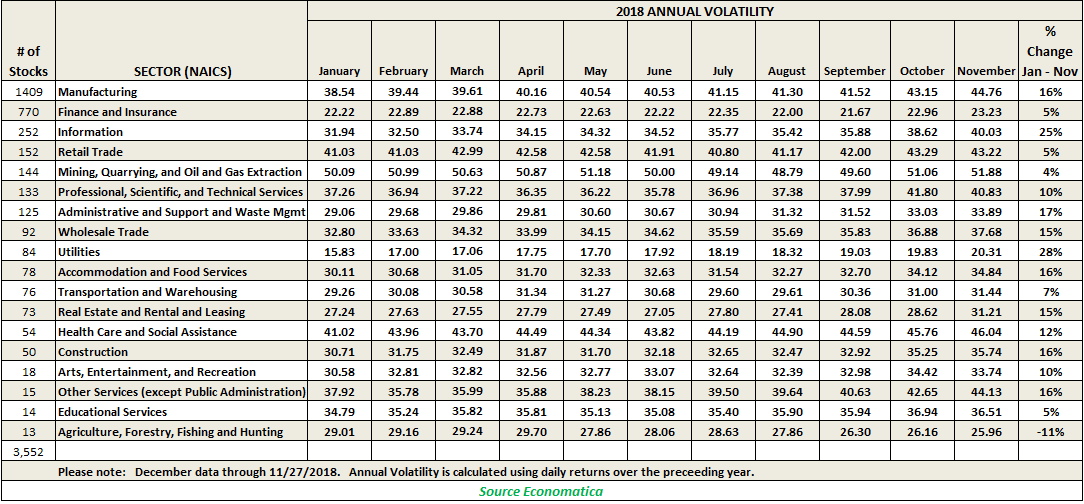
Market volatility has been dominating the news lately. In this report, we use the Economatica system to take a close look at monthly trend in volatility over the course of the year. The data shows that volatility has risen steadily year to date for almost every sector.
The Utilities industry, with 84 stocks participating, saw the biggest increase in volatility, rising 28% since January. The Information sector, with 252 participants, was a close second with a 25% increase in volatility compared to the beginning of the year.
The Manufacturing sector represents the largest segment of stocks, with 1,409 participants (40% of all stocks sampled). This sector saw volatility go up 16% since January. The second largest group with 770 participants is represented by the Finance and Insurance sector. This sector saw its volatility increase by 5% in the year.
Only one sector, Agriculture, Forestry, Fishing, and Hunting, with 13 participating stocks, experienced an 11% decline in volatility during the period examined.
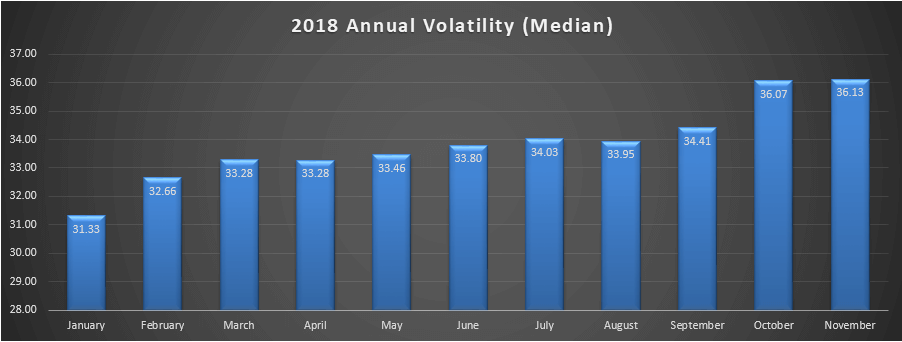
We aggregated these 18 sectors, a group comprised of 3,552 companies, and dug deeper into this trend in volatility and identified the median value for each month year-to-date.
All grouped together, November, October, and September saw the highest median values for volatility this year, 36.13, 36.07, and 34.41 respectively. The biggest change occurred from September to October, where the median volatility climbed by 5% when it went from 34.41 to 36.07 for the group. The lowest median volatility of the year was 31.33 for the month of January.
Economatica is an online investment research platform designed to facilitate deep fundamental and quantitative analysis. Asset managers, analysts, and other investment professionals have used Economatica for more than 30 years to research securities, identify opportunities, and make better investment decisions. To learn more please contact us.

In this edition of Value Reports we examined the IPO market in the 1st half...

In this edition of Value Reports, we explore the Top 25 foreign stocks ranked by...

Using the Economatica system we calculated the EV/EBITDA (TTM) multiple for key sectors in the...