
Using the Economatica system we examined the year-end results for 2017 and found improvement in companies’ Net Margin and Operating Margin with respect to prior years.
With most companies having already reported their fourth quarter 2017 financial statements, we used the Economatica system to aggregate all of the companies in the S&P 500 (excluding financials and insurance), as well as the general market (excluding financials and insurance), to determine TTM Net Margin and Operating Margin for these two groups.
Operating margin is a ratio used to measure a company’s pricing strategy and operating efficiency and operating margin gives analysts an idea of how much a company makes (before interest and taxes) on each dollar of sales. Generally speaking, the higher a company’s operating margin is, the better off the company is. If a company’s margin is increasing, it is earning more per dollar of sales.
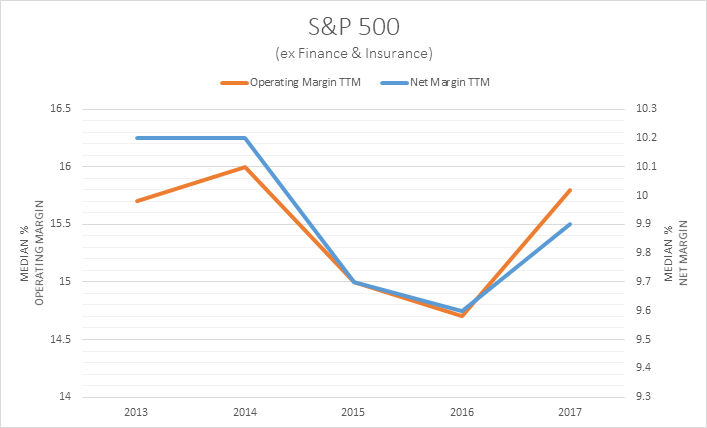
In looking at the median operating margin (TTM) for the S&P 500 (ex-financials and insurance) from 2013 to 2017 we made the following observations:
Operating margin (TTM) went from 15.7% in 2013 to 16% in 2014; the median ratio dropped to 15% in 2015 and declined further in 2016 to 14.7%. The ratio began its upward trend for this group in 2017, increasing to 15.8%. This means last year these companies were earning $0.158 (before interest and taxes) for every dollar of sales.
Net margin is an important indicator of a company’s financial health. The ratio often gives a more accurate view of how profitable a business is than its cash flow, and by tracking increases and decreases in its net margin, an analyst can assess whether or not current practices are having a positive influence on profitability.
When we examined the median net margin (TTM) for the S&P 500 (ex-financials and insurance) for the same 5 year period we could see immediately a close alignment with the trend for operating margin.
Net margin (TTM) remained stable at 10.2% in 2013 and 2014; the median ratio dropped to 9.7% in 2015 and declined further in 2016 to 9.6%. The ratio began its upward trend for this group in 2017, increasing to 9.9%. This means these companies made a profit of nearly $0.10 for every dollar of revenue.
Using the same methodology we examined the general market. Let’s see how these metrics have performed over the same five year period.
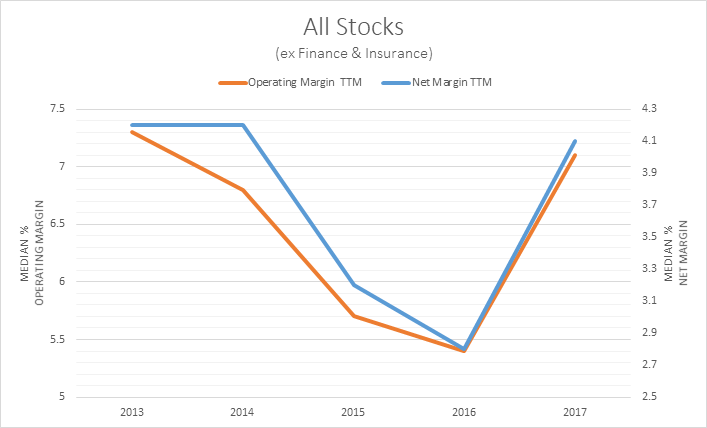
When we looked at the median operating margin (TTM) for the general market (ex-financials and insurance) from 2013 to 2017 we determined that:
Operating margin (TTM) declined from 7.3% in 2013 to 6.8% in 2014; the median ratio dropped further to 5.7% in 2015; and, in 2016, the metric declined a bit further to 5.4%. The general market experienced the same upward trend in 2017, going from 5.4% to 7.1%. The companies of the general market were earning $0.071 (before interest and taxes) for every dollar of sales last year.
When we examined the median net margin (TTM) for the general market (ex-financials and insurance) for this same period we noticed less overlap with operating margin, except for trending upwards last year.
Once again net margin (TTM) for the general market remained stable at 4.2% in 2013 and 2014; the median ratio dropped to 3.2% in 2015 and declined further in 2016 to 2.8%. The ratio began its upward trend for this group in 2017, increasing to 4.1%. This means the companies comprising the general market made a profit of $0.041 for every dollar of revenue.
The Economatica system offers a range of sophisticated analytic tools and financial data on an easy to use online research platform that empowers asset managers, analysts, and other investment professionals who conduct fundamental and quantitative analysis. Ask us for a free trial today and learn how to make your own observations.

In this edition of Value Reports we examined the IPO market in the 1st half...

In this edition of Value Reports, we explore the Top 25 foreign stocks ranked by...

Using the Economatica system we calculated the EV/EBITDA (TTM) multiple for key sectors in the...