
Observations from year-end valuations for the constituents of the Dow, S&P 500, and the General Market.
In this edition of Value Reports we examine 2017 year-end valuations for the purposes of framing investor expectations for the Dow, S&P 500, and the General Market.
Economatica defined the General Market as US companies (excludes foreign companies and ADRs) traded on the NASDAQ and NYSE exchanges. We further segmented this group by excluding the constituents of the S&P 500. In sum, the General Market is comprised of 3,080 publicly traded companies.
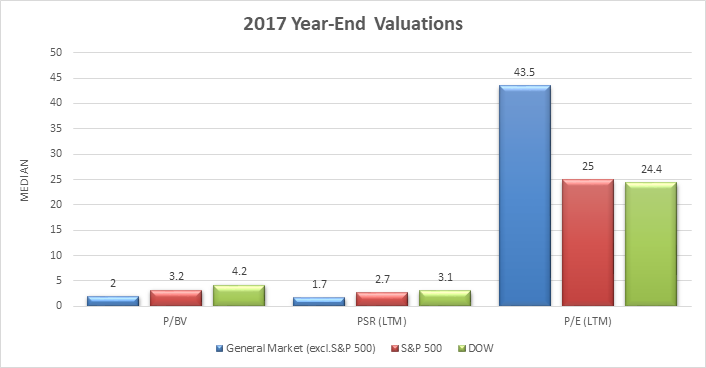
The chart below depicts the medians for Price to Book Value, Price to Earnings (LTM), and Price to Sales (LTM) ratios as of 12/31/2017, and are based on the companies’ latest financial filings.
Using the Economatica system to aggregate the three groups and then calculate the medians, we made the following observations: For Price to Book Value, the medians from lowest to highest are 2 for the General Market, 3.2 for the S&P 500, and 4.2 for the Dow. The median Price to Sales ratio for the General Market in 2017 was 1.7, then 2.7 for the S&P 500, and 3.1 for the Dow. And, finally, for Price to Earnings, highest to lowest, Economatica determined the median for the General Market to be 43.5, the S&P 500 25, and the Dow 24.4.
Valuations can often help investors set their expectations for future returns but this is hardly an exact science. Still, so long as fundamentals remain strong and continue to improve, investors can expect valuations to improve, too.
The median Price to Book Value, a metric favored by value investors, is comparably low, with the General Market having the lowest value of the three groups. And, although a PBV less than 1 is a solid indication of undervaluation, value investors will look at companies with a PBR of 3 or less, perhaps meaning there are more undervalued companies in the General Market. Using this range as a guide investors looking at either the Dow or S&P 500 will need to examine the constituents themselves before making any decisions.
Price to Sales ratio compares a company’s stock price to its revenues and like most ratios is insightful when examining companies within the same sector. Low ratios may indicate companies are possibly undervalued. Each of our groups has lower median values, indicating undervaluation, so investors may want to examine the General Market once again.
Price to Earnings is perhaps the best known valuation metric and is widely used by investment professionals to understand the potential for future earnings. The highest median P/E ratio is for the General Market, suggesting investors anticipate higher earnings growth in the future among these 3,080 stocks. The median P/E ratios for the S&P 500 and the Dow indicate, perhaps, that the earnings growth estimates for these two groups are more modest when compared to the General Market.
These broad observations can help direct investors where to start looking for investment opportunities.
With the Economatica system you can develop your own observations, drilling top down from the broader market, to sector, to individual companies themselves that may meet your investment criteria. Ask us for a free trial today.

In this edition of Value Reports we examined the IPO market in the 1st half...

In this edition of Value Reports, we explore the Top 25 foreign stocks ranked by...

Using the Economatica system we calculated the EV/EBITDA (TTM) multiple for key sectors in the...