
Using the Economatica system to filter through our comprehensive database of US exchange listed stocks, aggregating returns by sector to identify the industry with the highest year-to-date return.
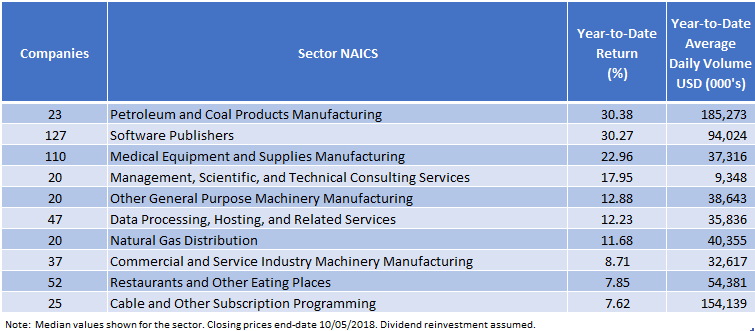
While the broader market indices have performed well through 10/05/2018, with the S&P 500 up 8.08% and the Dow Jones Industrial Average up 6.99% for the year, the Petroleum and Coal Products Manufacturing and the Software Publishers sectors have dominated the market so far this year, posting nearly identical year-to-date returns of 30.38% and 30.27% respectively. The Medical Equipment and Supplies Manufacturing sector comes in with the third highest year-to-date return (22.96%).
The table below shows the Top 10 performers by sector based on Year-to-Date Returns through 10/05/2018. Only sectors with 20 or more participating companies were considered.
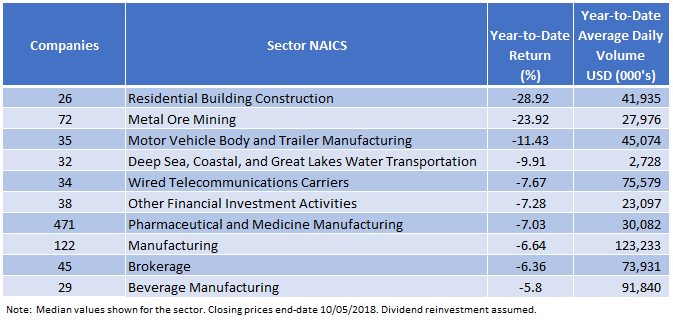
In contrast, the table below shows the Bottom 10 performers by sector so far this year (again through 10/05/2018).
The “biggest” losers so far this year include Residential Building Construction, and Metal Ore Mining, and Motor Vehicle Body and Trailer Manufacturing sectors, with negative year-to-date returns of -28.92%, -23.92%, and -11.43%, respectively.
Since the Petroleum and Coal Products Manufacturing sector had the highest year-to-date return we wanted to compare its performance with the broader market indices. To do this we created an index consisting of the 23 participating companies in this sector and plotted this index against the S&P 500 and Dow Jones indices.
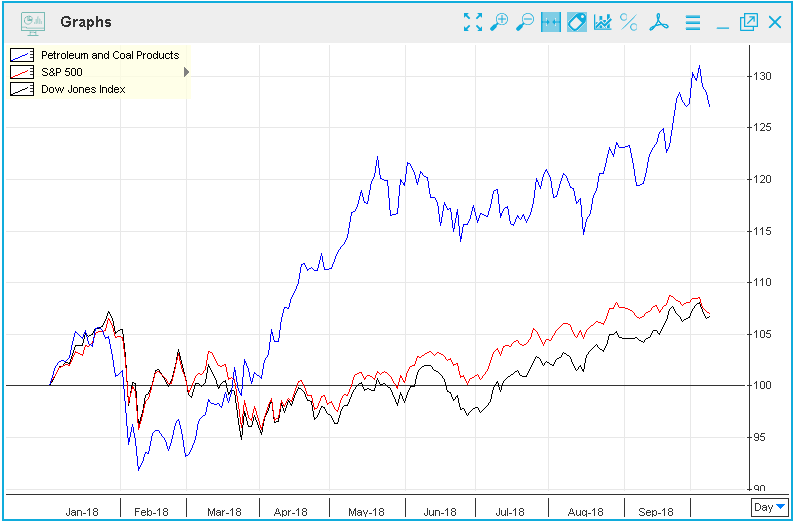
Using the Economatica system to build indices like the one depicted in the chart above clearly demonstrates this sector’s impressive year-to-date performance.
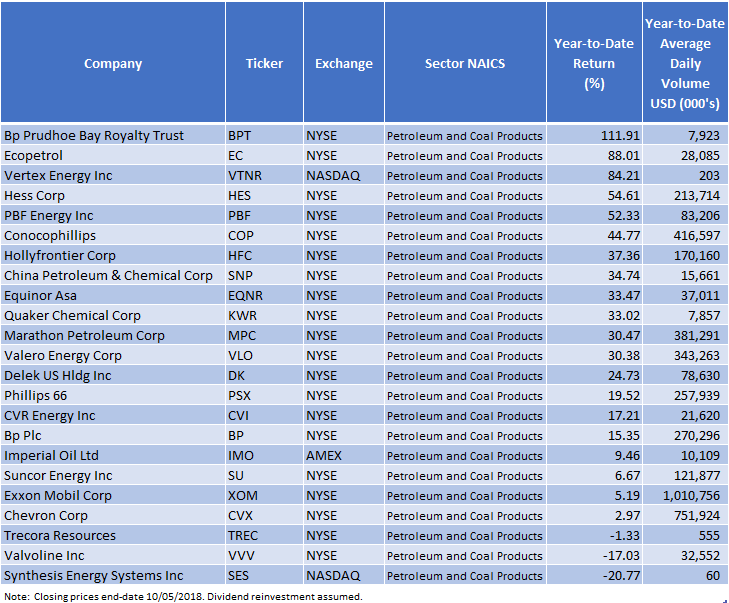
Ranking the Petroleum and Coal Products Manufacturing sector by Year to Date Return, highest to lowest, we identified a clear winner: BP Prudhoe Bay Royalty Trust, which posted an impressive 111.91% YTD return. Taking second and third place in this ranking are Ecopetrol and Vertex Energy, which posted year-to-date returns of 88.01% and 84.21%, respectively.
The Economatica system has sophisticated analytic tools and comprehensive highly reliable financial data giving investment professionals the flexibility needed to identify trends, uncover potential opportunities, and manage risk. Find out more.

In this edition of Value Reports we examined the IPO market in the 1st half...

In this edition of Value Reports, we explore the Top 25 foreign stocks ranked by...

Using the Economatica system we calculated the EV/EBITDA (TTM) multiple for key sectors in the...